
Photosynthetic Performance Index (PPI): what does it mean?
Ask a grower about their best-performing day and they will probably describe a sunny one. Yet your crop can perform better on a dark day than you would expect. Less available light does not mean your crop makes poorer use of that light.
The photosynthetic performance index (PPI) in MyLedgnd gives you insight into exactly that. It tells you how efficiently your crop used the light of a day, compared with what your crop could optimally have used. You only compare days with a similar amount of daily light. That way you see when your crop performed better or worse, and you can work out which climate went with it.
You may already know photosynthetic efficiency: the parameter that shows, moment by moment, how well your crop converts light. The PPI turns that into one number per day.
In short
- The PPI shows, per day, how efficiently your crop used the light, compared with other days with the same daily light integral.
- A high index on a dark day means: light used well, not high production.
- Put yesterday next to your best day and get insight into the underlying climate.
01
What is the photosynthetic performance index (PPI)?
The PPI is a daily index, expressed as a percentage, that shows how efficiently your crop used the light on that day.
The index looks at electron transport in the leaf. That is the first step of photosynthesis: the leaf converts captured light into energy. The plant then uses that energy to fix CO₂. So the PPI does not measure how much CO₂ your crop took up, nor how much it grew.
What does the number mean?
- 100%: your crop performed optimally for the available light.
- Below 100%: your crop could have performed better.
- Above 100%: your crop did better than the model expected.
Worked example. The bars are drawn to scale.
02
Why compare only days with roughly the same amount of light?
On a day with little light, your crop can by definition convert less light than on a sunny day. The goal is to understand why your crop had a high PPI on one day and a low PPI on another.
That is why the PPI compares each day only with days that had a similar amount of daily light. That amount is the daily light integral (DLI): all the light your crop receives in a day, in mol/m²/day. MyLedgnd puts days with roughly the same amount of light into the same group. Such a group is called a light class.
Your own best performance as the reference
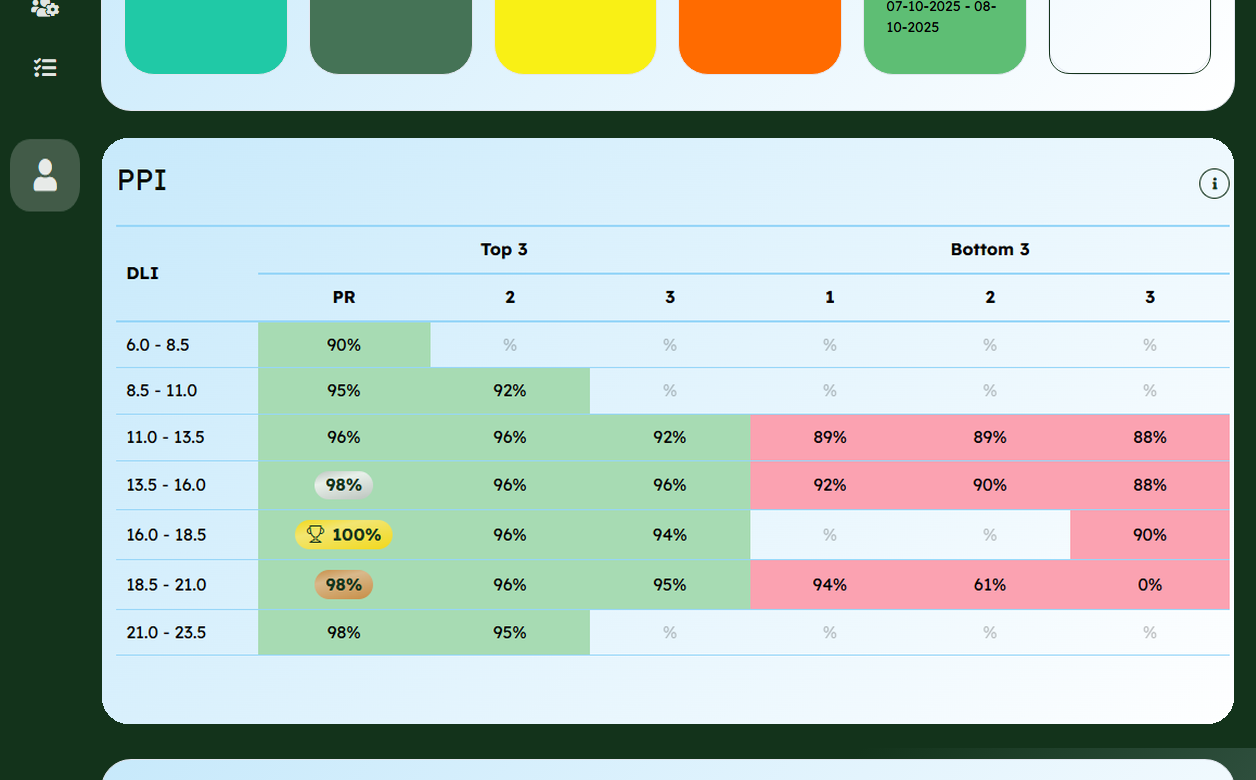
Think of it like running. You do not compare your 5K pace with your marathon; you compare it with your previous 5Ks. In the same way, your crop has a highest and a lowest PPI per light class. These are the days when things went particularly well or badly, and therefore the days you want to zoom in on.
03
How is the PPI calculated?
You do not need to know the calculation to use the index. In short, it works in three steps.
Measure: what did your crop do?
A fluorescence measurement determines how well the leaf converts the light it captures. That measurement is combined with the amount of light (PAR). This tells you how much electron transport actually took place.
Calculate: what was possible?
The model calculates how much electron transport would be optimal under that same light. The model is parameterised, which makes it specific to each crop.
Add up and divide
Both are added up over the whole day. The ratio between the measured and the optimal total is your PPI.
Researchers use the same approach to monitor the photosynthesis of a greenhouse crop. The PPI makes this visible at a daily level.
Do you often score above 100%? Then the model needs to be calibrated for your crop and specific variety. Let us know.
04
A high index does not automatically mean more growth
This is where it often goes wrong. In the example, the crop scored 95% yesterday. On the best day it scored 100%. Almost the same, then. But look at the figures below.
| Value | Yesterday | Best day |
|---|---|---|
| PPI | 95% | 100% |
| Light over the day (DLI) | 9.9 mol/m²/day | 17.3 mol/m²/day |
| Electron transport over the day | 2.45 mol/m²/day | 4.32 mol/m²/day |
Yesterday the crop used the light almost as well. But there was much less light. As a result, there was about 43% less electron transport.
The lesson: a high PPI on a dark day means the little light available was used well. It does not mean your crop did a lot. So always look at the PPI and the daily light integral together.
05
How do you use the PPI in your cultivation?
The PPI only becomes really useful when you put a day next to your best day. Here is how:
- Choose a period of at least four weeks. That gives you enough days per light class.
- Check how many days have good measurement data. If that is below 90%, be careful with your conclusions.
- Find your best and weakest days in the PPI table. Only compare days in the same row.
- In the climate table, put a day next to your best day. Click the date. You will then see the course of the day, with the index for each moment.
- 1Find the moment. Does the index drop while there is plenty of light? Then your crop is using the light less well at that moment.
- 2Check the climate. What happened at that moment? Was it very warm, was the CO₂ level low, or was the air very dry (high VPD)?
- 3Compare it with your best day. Look at the same moment on your best day with roughly the same amount of light. What was different?
Found something? Treat it as a lead, not as proof. Irrigation, fertilisation, the growth phase of the crop and the condition of the leaf can also affect the index. So use the PPI as a starting point, and check the crop yourself as well. Want to dig deeper, moment by moment? Then light deviation helps: how much of the light your crop is not using at a given moment.
You often cannot see this kind of stress from the outside, or only when it is too late. Read which signals your plant gives earlier in the whitepaper How to spot invisible plant stress.
06
What does the PPI not tell you?
An index only works if you know what it is meant for. Keep these four things in mind.
How much your crop produced
The PPI measures how well the light was used. Not how much CO₂ your crop fixed, and not how much it grew.
How days with a lot and a little light compare
Only compare days in the same row of the PPI table. Want to know how much more a sunny day delivered? Then look at the daily light integral (DLI) and the electron transport over the day in the climate table.
How you are doing compared with other growers
The model differs per crop and sometimes per variety. The index is designed to compare your crop with itself, not with another grower's crop.
Whether the measurement was right
The index is only as good as the measurement. Is more than 10% of the measurement data missing on a day? Then the index gets a warning. Is more than 20% missing? Then no index is shown. Seeing 0% under normal light? Then the measurement has probably failed. Report the date to support.
07
Your own best day as the benchmark
Data does not replace your craftsmanship. But it does give your experience a fixed reference point. The PPI does not compare your crop with a textbook standard, but with itself, on days with roughly the same amount of light. That way you know which day you want to repeat, and which climate went with it.
Start simple: put yesterday next to your best day with roughly the same amount of light. Then look at the trend over a few weeks, and at how it relates to VPD and other early stress signals.
Frequently asked questions
Can the PPI go above 100%?
Yes. The index compares a measurement with a model. If your crop does better than the model expects, you go above 100%. Does that happen often? Let us know. Then the model needs to be calibrated for your crop and specific variety.
Why is my best day not a sunny day?
The PPI measures how well the light was used, not how much light there was. On a dark day the bar is lower too. Your crop can then use the little light very well. That says something about efficiency, not about growth.
Why are there empty cells in the PPI table?
In the selected period there were too few days with that amount of light. Choose a period of at least four weeks and the table fills up better.
Why does my top 3 change when I change the period?
The top 3 and bottom 3 only cover the period you select. Choose a different period and different days are included. Your personal record (PR) looks further back: it is the highest index your crop has ever reached in that light class.
Can I compare my PPI with that of another grower?
Not just like that. The model differs per crop and sometimes per variety. The greenhouse and the way of growing play a role too. The PPI is meant to compare your crop with itself.
Spot stress before you see it
- Real-world cases of invisible plant stress
- Which types of plant stress there are
- Which stress signals you are missing
- What the consequences are and how to prevent stress

Sources
- Crop Photosynthetic Performance Monitoring Based on a Combined System of Measured and Modelled Chloroplast Electron Transport Rate in Greenhouse Tomato, Yu, Körner and Schmidt, Frontiers in Plant Science, 2020

Jorn Boone
Marketing Expert
Technically reviewed by Kees
New articles
Ledgnd x HortiSoccer World Cup Pool 2026 brings the horticultural industry together
With the launch of the renewed Ledgnd x HortiSoccer World Cup Pool 2026, people working across the horticultural industry once again get the chance to compete against each other during the FIFA World…
GreenTech Amsterdam 2026
From 9 to 11 June 2026, RAI Amsterdam will be all about GreenTech, the international trade fair for the horticulture sector. Professionals from around the world will come together to share knowledge a…
HortiContact 2026 Recap
Ledgnd Reflects on a Successful Edition of HortiContact 2026 HortiContact 2026 at Evenementenhal Gorinchem once again served as a meeting place for the Dutch greenhouse horticulture sector. Ledgnd loo…
Read more
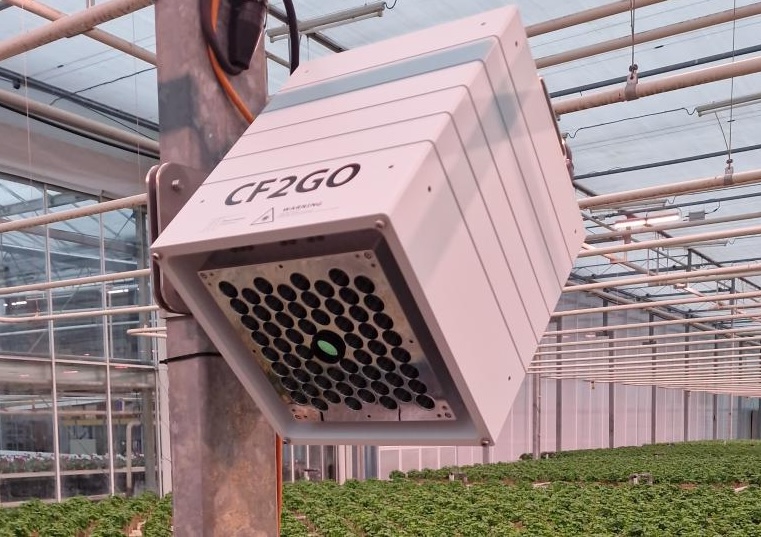
CF2GO Sensor: What It Measures and What You Do With It
More light does not automatically mean more growth. Your climate computer shows how much light your crop receives, but not how efficiently it uses that light. The CF2GO measures photosynthetic efficie…
Ledgnd x HortiSoccer World Cup Pool 2026 brings the horticultural industry together
With the launch of the renewed Ledgnd x HortiSoccer World Cup Pool 2026, people working across the horticultural industry once again get the chance to compete against each other during the FIFA World…
GreenTech Amsterdam 2026
From 9 to 11 June 2026, RAI Amsterdam will be all about GreenTech, the international trade fair for the horticulture sector. Professionals from around the world will come together to share knowledge a…
Do you want to know more?
Interested in what Ledgnd can do for you? Leave your phone number, and we will contact you as soon as possible for a non-binding informational conversation