
CF2GO Sensor: What It Measures and What You Do With It
More light does not automatically mean more growth. Your climate computer shows how much light your crop receives, but not how efficiently it uses that light. The CF2GO measures photosynthetic efficiency and shows when extra light becomes less effective and light stress sets in. That lets you match your lighting to what your crop really needs.
In short
- The CF2GO sensor does not measure the environment, but the response of the plant: how efficiently your crop converts light.
- It measures without contact, from up to 100 cm above the crop, using the fluorescence of the leaf.
- Do not look at a single Fv/Fm value, but at the pattern over the day.
- The data helps you adjust: screening, dimming the lighting, your daily light integral per crop and recovery at night.
01
What does the CF2GO sensor measure?
The CF2GO is a plant sensor made by PhenoVation. It hangs up to 100 cm above the crop and measures how efficiently your plants convert light into growth, without touching the leaf. It succeeds the CropObserver from the same company and, according to PhenoVation, is about 30% cheaper.
The difference
The CF2GO does not measure the environment, but the response of the plant.
A PAR sensor tells you how much light you provide. The CF2GO tells you whether your crop actually does something with it.
The sensor was launched in early 2025. Here, the question is what you do with it in your greenhouse.

02
How do you measure photosynthesis without touching the leaf?
The answer lies in what happens to light as soon as it falls on a leaf.
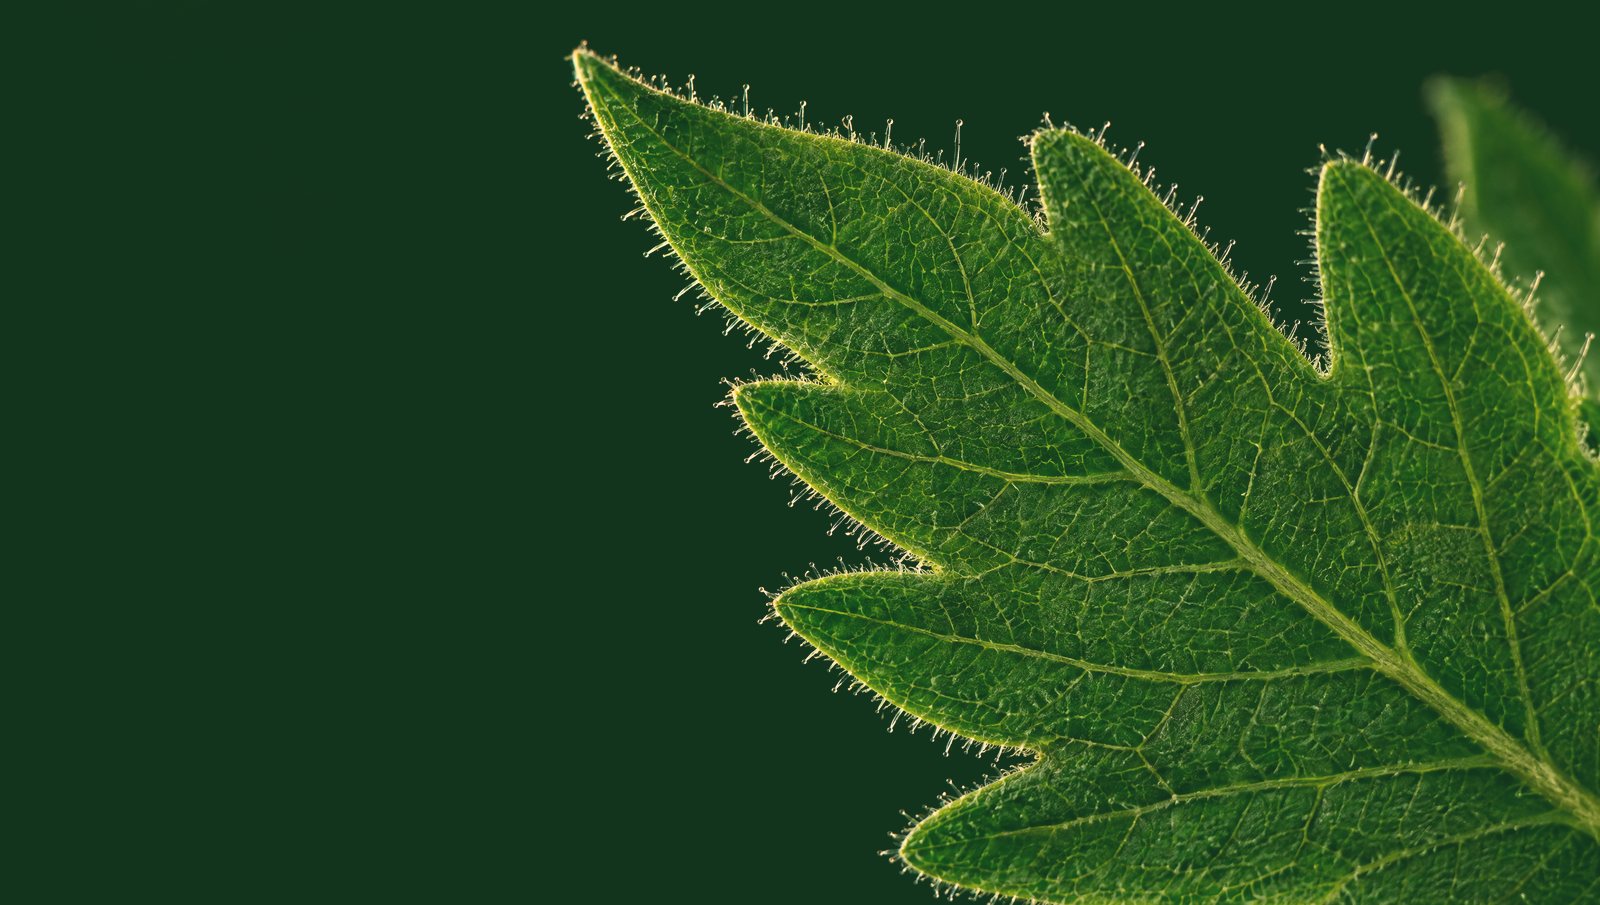
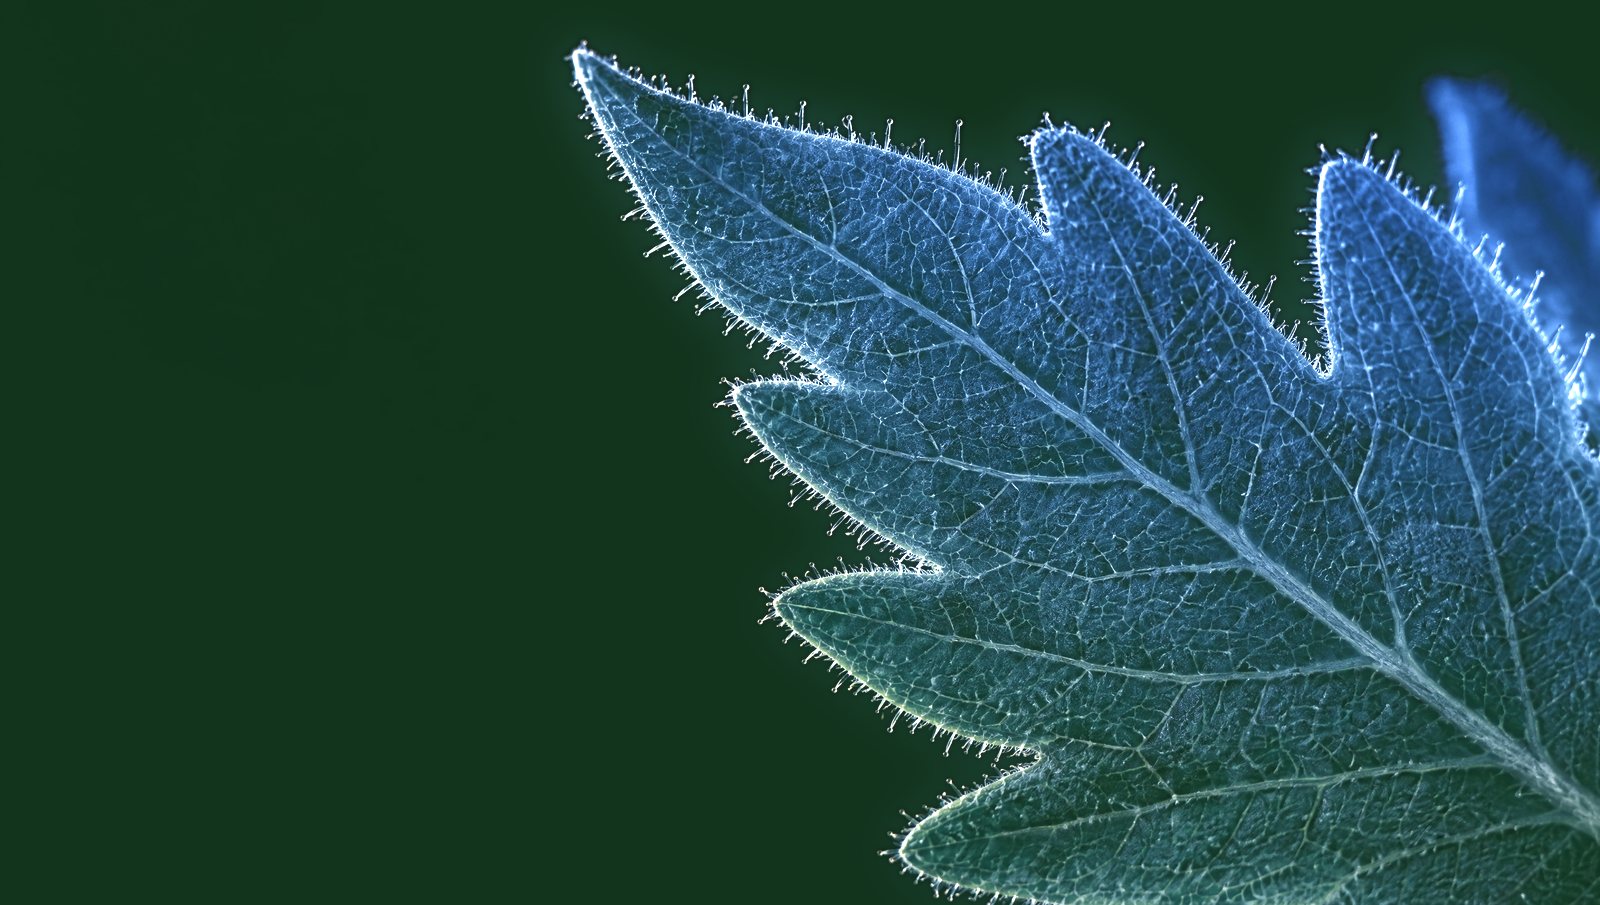
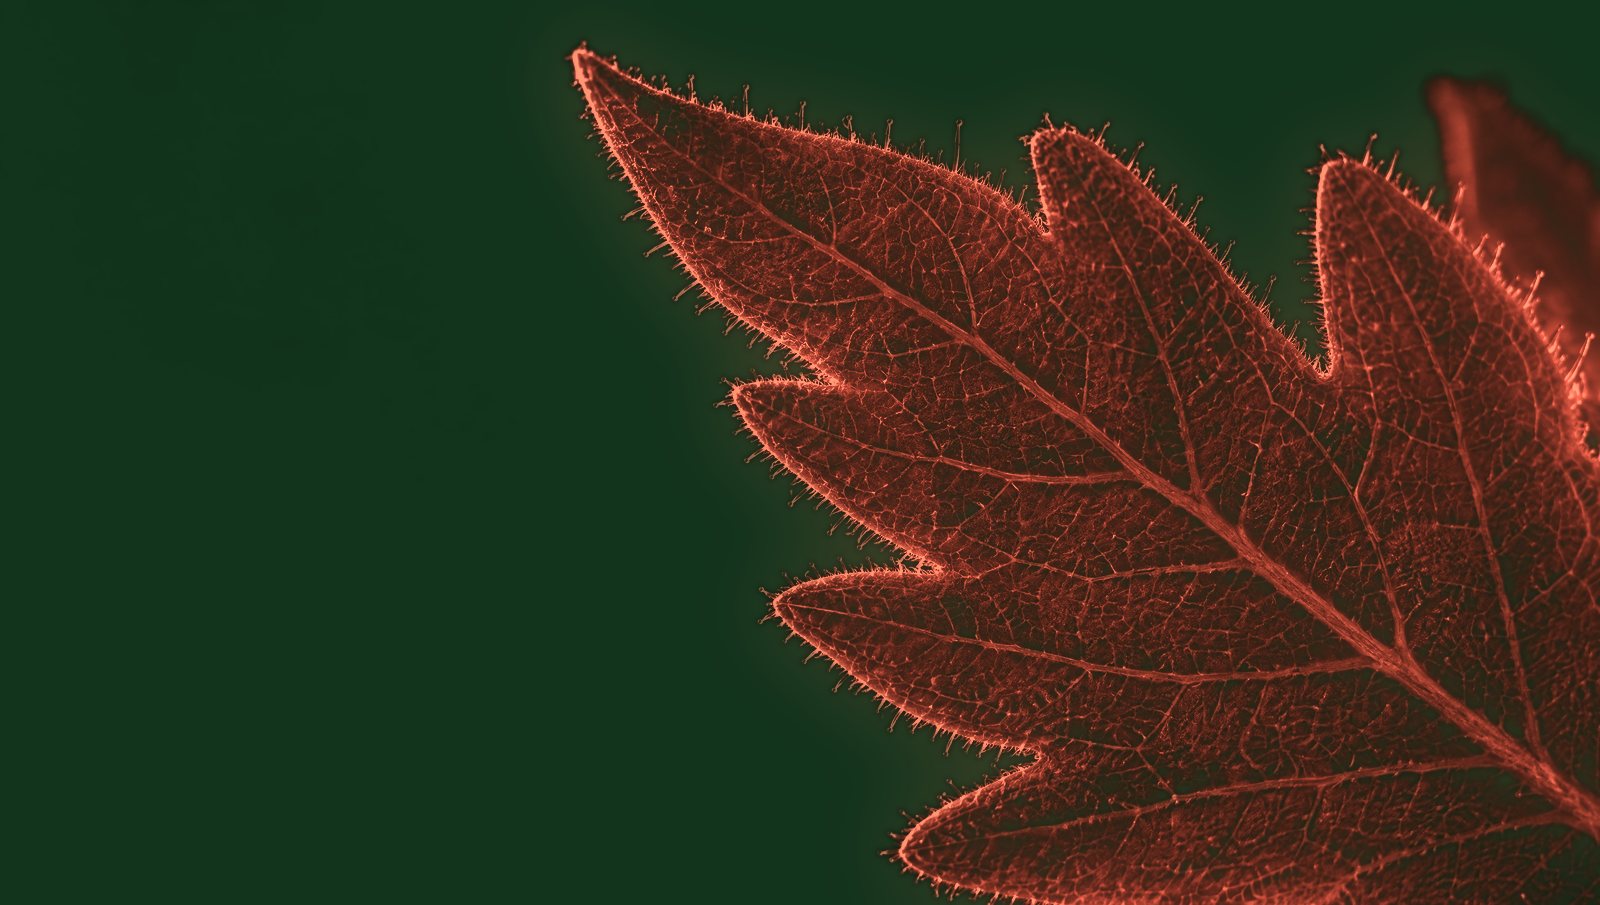
Those three keep each other in balance. If you measure how much light comes back as fluorescence, you know how much goes into photosynthesis. Because the sensor captures that re-emitted light, it does not need to touch the leaf.
PhenoVation stresses that the CF2GO measures the plant directly and does not use AI to predict photosynthesis. So you are looking at a measurement, not at a model that guesses.
03
Which values does the CF2GO give, and how do you read them?
These are the values the CF2GO delivers, and what they are useful for.
| Value | What it is | What it tells you |
|---|---|---|
| Fv/Fm | The maximum photosynthetic efficiency: how much of the captured light the leaf can convert | Whether photosynthesis is healthy. At night, the reference for a healthy leaf is around 80% |
| NPQ(t) | Non-photochemical quenching: how much excess light energy the plant dissipates as heat | How hard the plant has to protect itself against too much light |
| TFm | The time the leaf needs after the flash to reach maximum fluorescence (Fm) | According to PhenoVation, an early signal of stress |
The 80% for a healthy leaf at night comes from research into fluorescence sensors in greenhouse horticulture by the Dutch programme Kas als Energiebron. The same research showed in Phalaenopsis that the pattern over the day says more than the exact number.
So do not look at a single value, but at the pattern over the day. During the day, efficiency always drops somewhat as light increases; that is normal. What matters is how deep the dip is, how long it lasts and whether the plant recovers at night.
A complete fluorescence curve in every measurement
The CF2GO does not measure one number, but the whole curve along which fluorescence rises after the flash: the OJIP curve. It does so with up to 1,000 measurements per second. The shape of that curve yields several values about how the photosynthetic system is working, not just Fv/Fm.
04
Which cultivation decisions do you make with the CF2GO?
A sensor is not a goal in itself. It is only worth something if it changes the way you steer. These are the four decisions where photosynthetic efficiency helps most.
- Screening during light stress. If efficiency drops sharply and NPQ rises, your crop is catching more light than it can use. That is the moment to screen or dim the lighting.
- Dimming the lighting at the end of the day. Light the plant no longer converts costs electricity and causes stress. At Van Geel Group, plant data showed that too much light at the end of the day caused stress that the orchids still suffered from in the days after.
- Setting your DLI per crop. The DLI is the total amount of light per day. Photosynthesis data shows up to which daily light integral your crop still works efficiently, and where it tips over. Use the DLI calculator to work out your own daily light integral.
- Tracking recovery at night. If Fv/Fm does not return to its normal level at night, the plant had too much to process the day before. A reason to steer more gently the next day.
Keep in mind that values differ per crop, light level and growth phase. So measure for a few weeks first, before you set fixed thresholds.
05
Contactless or on the leaf: what is the difference?
You can measure photosynthetic efficiency in several ways. No method is better at everything; it depends on what you want to know.
| Leaf sensor | CF2GO | CropObserver | |
|---|---|---|---|
| How | On or near one fixed leaf | Contactless, up to 100 cm above the crop | Scans a grid of hundreds of points from a height of 1 to 3 m |
| Strong at | Accurate at one point | Larger area, nothing attached to the plant | Many measuring points spread across the crop |
| Watch out | Choose the leaf carefully (no edge plant), move it periodically | Hangs in one fixed spot, unless mounted on a moving system | More expensive and more complex |
At the launch, Ledgnd co-founder Ramón de Vrie already pointed out that the CF2GO measures reliable Fv/Fm values over a large area this way. A leaf sensor, by contrast, looks very precisely at a single leaf. Which one fits depends on your greenhouse and your question. We also compare the CF2GO with other plant feedback systems, such as the Sendot leaf sensor and sap flow measurement.
06
How do you connect the CF2GO to your climate computer and MyLedgnd?
The CF2GO works with a standard TCP/IP protocol and can be controlled from the PLC or computer you already use. It can be mounted in a fixed position or travel along on a moving system, such as a spray boom.
How the CF2GO data gets into MyLedgnd
All CF2GO measurements come into the online data platform MyLedgnd. There, the data is processed and shown clearly, next to your PAR, temperature and humidity data. So you see not only what the climate in your greenhouse is like, but also how your crop responds to it.
That changes the way you steer. Instead of fixed thresholds for DLI or VPD, you use the response of the plant itself: you see how light and temperature affect photosynthetic efficiency, and adjust screening, lighting and other settings accordingly.
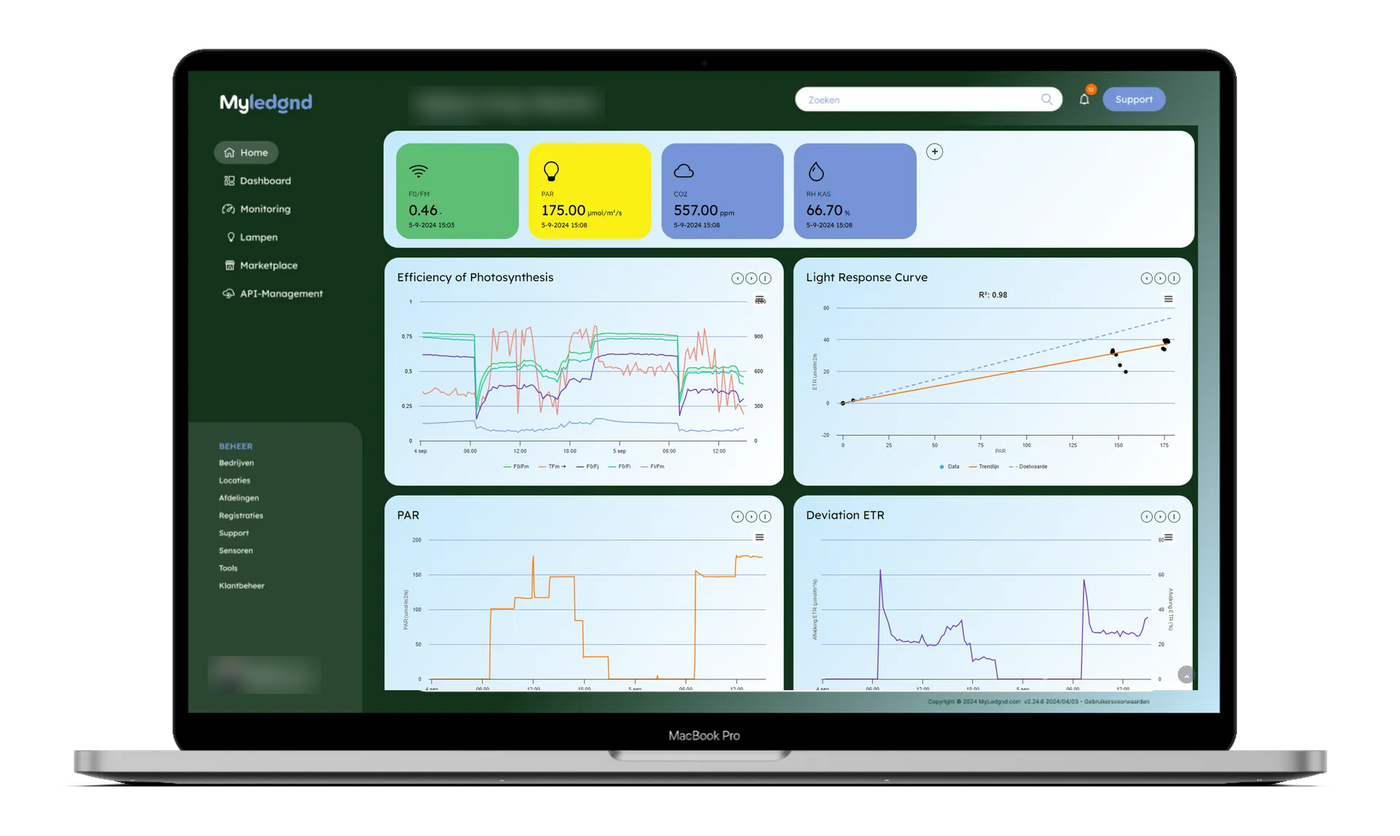
What photosynthetic efficiency looks like
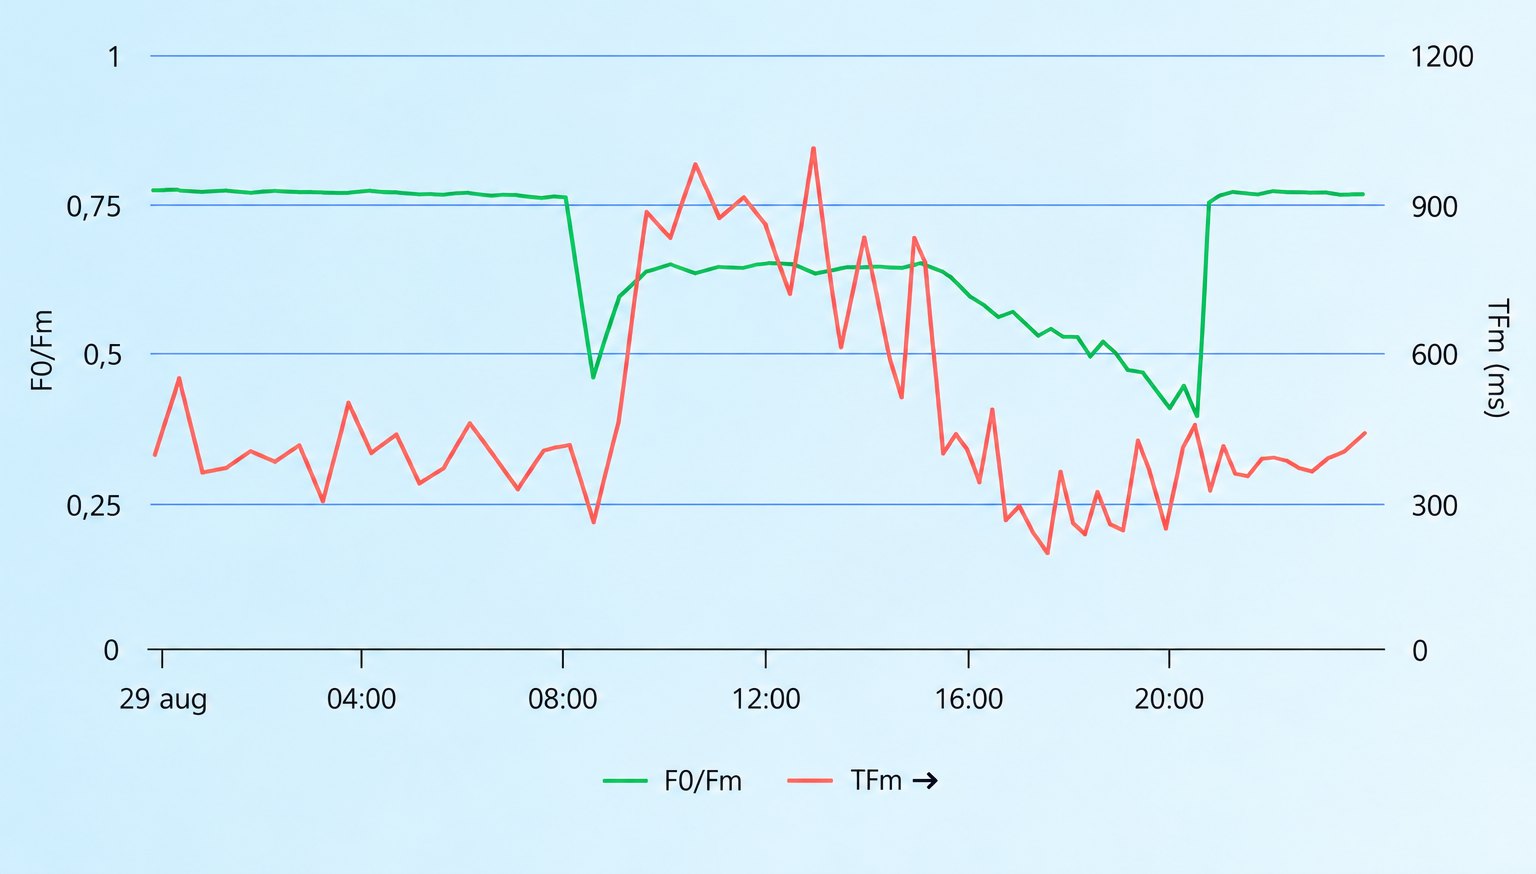
Below is one day from MyLedgnd. The green line is photosynthetic efficiency, the red line is TFm. The course over the day says more than a single value.
 1
2
3
4
- 1At night, in the dark, efficiency is stable at around 0.77.
- 2Between 08:00 and 09:00 it drops in one go, as soon as the leaf receives light.
- 3During the day it is lower, around 0.64. That is normal: not all light can go into photosynthesis.
- 4Shortly after dark it is back at its night-time value: the leaf recovers.
If the line drops deeper or for longer during the day than you are used to, or no longer recovers fully at night, put it next to your PAR and temperature in MyLedgnd. That shows you whether it is the light, the heat or something else. Also see which other systems we connect.
07
Conclusion
The CF2GO sensor measures what your climate computer does not: how efficiently your crop really converts light. It does so without contact and over a larger area than a leaf sensor. The value is not in the device, but in what you do with the data: screening earlier, dimming the lighting when the plant no longer uses it, and matching your daily light integral to what the crop can handle. Measuring only makes sense if you act on it.
Not sure which plant sensor suits your greenhouse and crop? Let us take a look with you, no strings attached.
Frequently asked questions
What does the CF2GO sensor measure?
The CF2GO measures the photosynthetic efficiency of your crop, without touching the leaf. The key values are Fv/Fm (how healthy photosynthesis is) and NPQ (how much light the plant dissipates as heat). Together they show when light produces growth and when it causes stress.
What is the difference between the CF2GO and the CropObserver?
Both are made by PhenoVation and measure photosynthetic efficiency from a distance. The CropObserver scans a grid of hundreds of points from a height of 1 to 3 metres. The CF2GO is its successor: it hangs up to 100 cm above the crop and, according to PhenoVation, is about 30% cheaper.
What is a good Fv/Fm value?
A healthy leaf reaches an efficiency of about 80% at night. During the day the value always drops somewhat with more light. More important than the exact number is the pattern: how deep the dip is during the day, how long it lasts and whether the plant fully recovers at night.
Does the CF2GO also work in a greenhouse without supplementary lighting?
Yes. PhenoVation states that the sensor is suitable for both lit and unlit cultivation. In an unlit greenhouse it mainly helps with your screening strategy: you see when sunlight at peak moments causes more stress than growth, so you can screen in time.
Can you connect the CF2GO to your climate computer?
The sensor works with a standard TCP/IP protocol and can be controlled from a PLC or computer you already use. In MyLedgnd you see the measurement data right next to your climate and light data, so you can see how your plant responds to your climate.
Learn to see what your plant is telling you
- Which signals your plant gives
- Which types of plant stress there are
- How to adjust earlier

Sources
- Soft launch of the Cf2Go sensor at HortiContact 2025, HortiDaily, 5 February 2025
- Measuring photosynthesis efficiency without physical contact with a plant, HortiDaily, 4 November 2024
- Eindrapport Hortisensor (E17007) (in Dutch), Plant Lighting and Kas als Energiebron, 2019
- R.J. Strasser, A. Srivastava and M. Tsimilli-Michael, The fluorescence transient as a tool to characterize and screen photosynthetic samples, in: Probing Photosynthesis, 2000

Jorn Boone
Marketing Expert
Technically reviewed by ...
New articles
Ledgnd x HortiSoccer World Cup Pool 2026 brings the horticultural industry together
With the launch of the renewed Ledgnd x HortiSoccer World Cup Pool 2026, people working across the horticultural industry once again get the chance to compete against each other during the FIFA World…
GreenTech Amsterdam 2026
From 9 to 11 June 2026, RAI Amsterdam will be all about GreenTech, the international trade fair for the horticulture sector. Professionals from around the world will come together to share knowledge a…
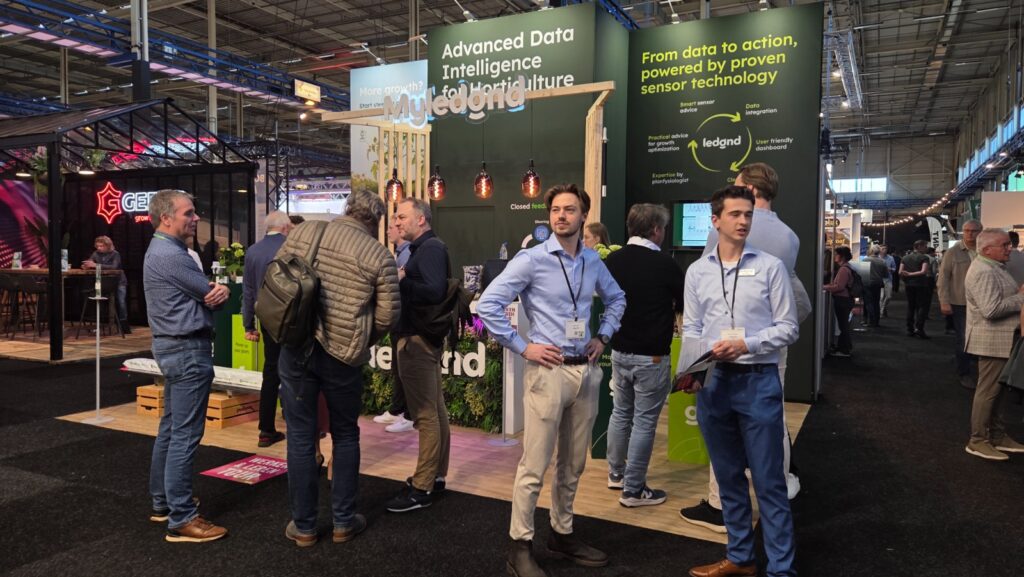
HortiContact 2026 Recap
Ledgnd Reflects on a Successful Edition of HortiContact 2026 HortiContact 2026 at Evenementenhal Gorinchem once again served as a meeting place for the Dutch greenhouse horticulture sector. Ledgnd loo…
Read more
Photosynthetic Performance Index (PPI): what does it mean?
Ask a grower about their best-performing day and they will probably describe a sunny one. Yet your crop can perform better on a dark day than you would expect. Less available light does not mean your…
Ledgnd x HortiSoccer World Cup Pool 2026 brings the horticultural industry together
With the launch of the renewed Ledgnd x HortiSoccer World Cup Pool 2026, people working across the horticultural industry once again get the chance to compete against each other during the FIFA World…
GreenTech Amsterdam 2026
From 9 to 11 June 2026, RAI Amsterdam will be all about GreenTech, the international trade fair for the horticulture sector. Professionals from around the world will come together to share knowledge a…
Do you want to know more?
Interested in what Ledgnd can do for you? Leave your phone number, and we will contact you as soon as possible for a non-binding informational conversation