KNMI weather forecasts now available on the MyLedgnd homepage
MyLedgnd now includes a new convenient feature. Thanks to a new connection with the KNMI, accurate weather forecasts are now automatically displayed on your MyLedgnd homepage. You can see in real time which weather conditions are affecting the outside of your greenhouse, up to 48 hours in advance. External weather apps? You no longer need them. The KNMI data is freely available to all MyLedgnd users.
Weather information for the next two days
The KNMI weather information shows the current conditions and forecasts for the next two days, accurate to a 2 by 2 kilometre area around your greenhouse. This allows you to take timely action against heat peaks, cold nights or sudden sunlight. In doing so, you prevent your greenhouse climate from getting out of balance.
What do you see on the Weather Forecasts dashboard?
On the weather forecasts dashboard you see at a glance all essential weather data that can directly influence your cultivation decisions:
Temperature (°C): Current and expected outside temperature, important for heat radiation and ventilation planning
Radiation (W/m²): Solar radiation, crucial for photosynthesis and light input
Precipitation (mm): For irrigation planning, greenhouse ventilation and water collection
Relative humidity (%): Affects evaporation and air exchange
Absolute humidity (g/m³): Helps manage the moisture balance in the greenhouse environment
Wind speed (m/s): Essential for natural ventilation and heat loss
Wind direction: Relevant for opening roof vents and adjusting screen settings
Thanks to these short-term forecasts you can respond in time to periods of heat, cold or increased sunlight. This gives you as a grower full control over your greenhouse climate even before conditions actually change.
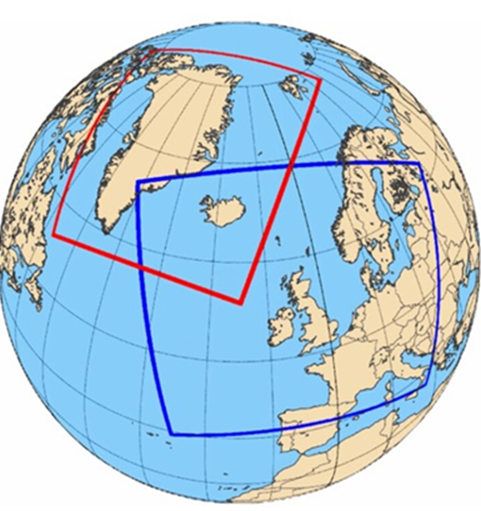
Freely available within the KNMI Grid
Is your company located within the geographical grids of the KNMI? Then this feature is completely free to use within MyLedgnd. No additional installation or subscription required, just clear weather insights, directly on your dashboard. View the KNMI weather grid below.
Not a MyLedgnd user yet?
Then get in touch with us. We’ll be happy to show you how you can use your greenhouse data and KNMI weather data to optimise your cultivation.
New articles
Ledgnd x HortiSoccer World Cup Pool 2026 brings the horticultural industry together
With the launch of the renewed Ledgnd x HortiSoccer World Cup Pool 2026, people working across the horticultural industry once again get the chance to compete against each other during the FIFA World…
GreenTech Amsterdam 2026
From 9 to 11 June 2026, RAI Amsterdam will be all about GreenTech, the international trade fair for the horticulture sector. Professionals from around the world will come together to share knowledge a…
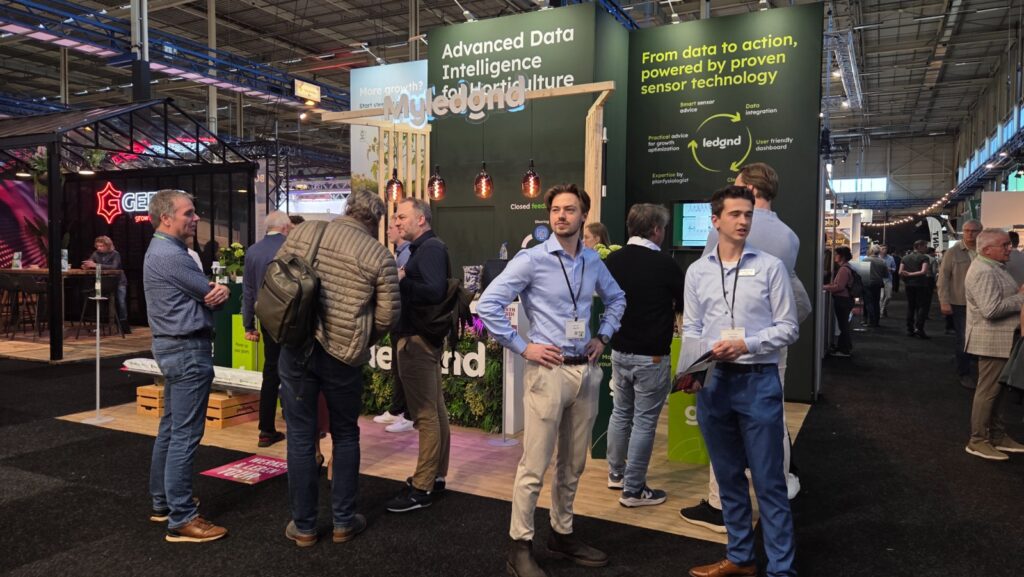
HortiContact 2026 Recap
Ledgnd Reflects on a Successful Edition of HortiContact 2026 HortiContact 2026 at Evenementenhal Gorinchem once again served as a meeting place for the Dutch greenhouse horticulture sector. Ledgnd loo…
Read more
Ledgnd x HortiSoccer World Cup Pool 2026 brings the horticultural industry together
With the launch of the renewed Ledgnd x HortiSoccer World Cup Pool 2026, people working across the horticultural industry once again get the chance to compete against each other during the FIFA World…
GreenTech Amsterdam 2026
From 9 to 11 June 2026, RAI Amsterdam will be all about GreenTech, the international trade fair for the horticulture sector. Professionals from around the world will come together to share knowledge a…
HortiContact 2026 Recap
Ledgnd Reflects on a Successful Edition of HortiContact 2026 HortiContact 2026 at Evenementenhal Gorinchem once again served as a meeting place for the Dutch greenhouse horticulture sector. Ledgnd loo…
Do you want to know more?
Interested in what Ledgnd can do for you? Leave your phone number, and we will contact you as soon as possible for a non-binding informational conversation


