PAR Sensor | What is it and how to use it?
The PAR sensor measures the radiation between 400-700 nm (the light spectrum used by plants for photosynthesis) and displays it as PPFD (Photosynthetic Photon Flux Density) in µmol/m²/s.
Installation of the PAR sensor
Install the PAR sensor on a fixed object, such as a metal pole, and use a spirit level to align it properly (see image 1).
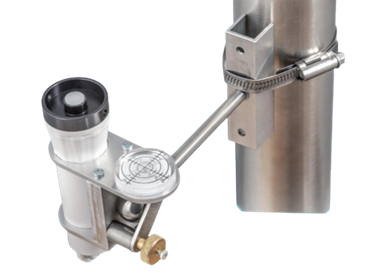
Image 1. PAR sensor
The height of the PAR sensor is set depending on the measurement objective:
- Above the crop to measure the incoming radiation.
- Between or beneath the crop to measure the actual radiation on the crop.
Do’s and Don’ts while installing a PAR sensor
- Install the sensor on or to a sturdy structure (for example, a post).
- Make sure the sensor is level.
- Clean the glass on the PAR sensor regularly for accurate measurements.
Analyzing data from the PAR sensor
Every five minutes, the PAR sensor transmits the light intensity to the portal of MyLedgnd. Here you can see the moments when the radiation intensity was highest. Excessively high radiation intensities can then be prevented by timely shading.
With this data, you can also calculate the cumulative radiation per day. This way, you can easily compare the total radiation on a day (also known as the light sum or DLI) with that of other days. The light sum indicates how many assimilates the plants were able to produce.
With too low a light sum, you miss out on potential growth. When, at some point, suddenly too much light comes in (as shown in image 2), it can lead to stress in a plant.
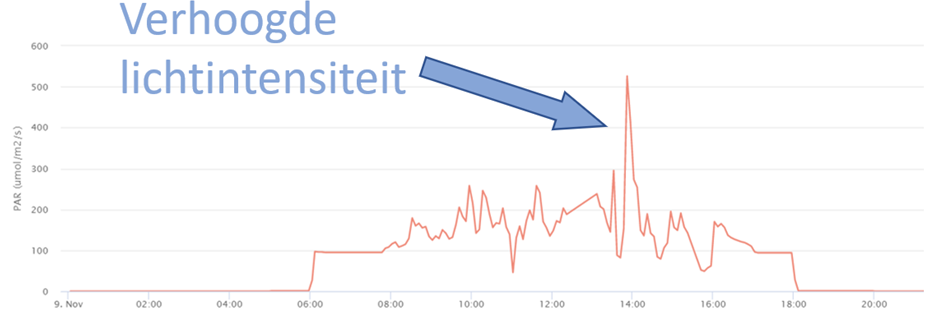
Image 2. Increased light intensity
Important information: the balance between temperature and light
Light is the most important factor for biomass production, while temperature is the key factor for a plant’s development and growth rate. What practical consequences does this have?
For example:
-
- Light produces assimilates through photosynthesis, but a plant cannot make use of them if the temperature is very low. Adequate light combined with too low a temperature results in plants that have plenty of biomass but remain too small and lag in their development.
- Temperature drives plant growth, but when there is insufficient light, there aren’t enough assimilates available. For the plant to grow, it needs enough assimilates. As a result, weak plants emerge that, despite being advanced in their development, have too little biomass.
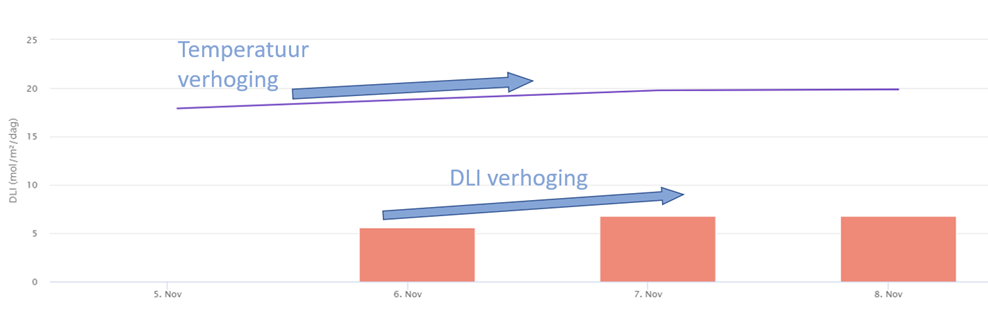
Conclusion: a proper balance between the daily temperature and the light sum is extremely important for the development and quality of a plant. This ensures that the assimilates produced are optimally utilized at the right moments. In image 3, an example is shown of an increase in both the light sum and the average temperature.
Image 3
What conclusions can you draw from the measured data?
By comparing the PAR sensor data with readings from other sensors, like the T/RV sensor, soil sensor, and CO₂ sensor, you can gain insights into several aspects of plant performance and environmental interactions:
-
- Air temperature: The influence of light on the warming of a greenhouse.
- Leaf temperature: By examining the effect of light intensity on leaf temperature, you can determine whether your plant can handle a specific light intensity. For example, if the leaf temperature does not rise with an increase in light intensity, the plant may be capable of tolerating even higher light levels. Additionally, you can assess whether the plant/leaf temperature is in balance with the given light sum.
Advice from Ledgnd and conclusion
The PAR sensor provides insight into the stress moments of plants and calculates the light sum (or DLI), which can be compared with other days. It is also important to monitor the balance between the light sum and the daily temperature. If there is insufficient light, we recommend maintaining a cooler daily temperature, and vice versa.
New articles
Ledgnd x HortiSoccer World Cup Pool 2026 brings the horticultural industry together
With the launch of the renewed Ledgnd x HortiSoccer World Cup Pool 2026, people working across the horticultural industry once again get the chance to compete against each other during the FIFA World…
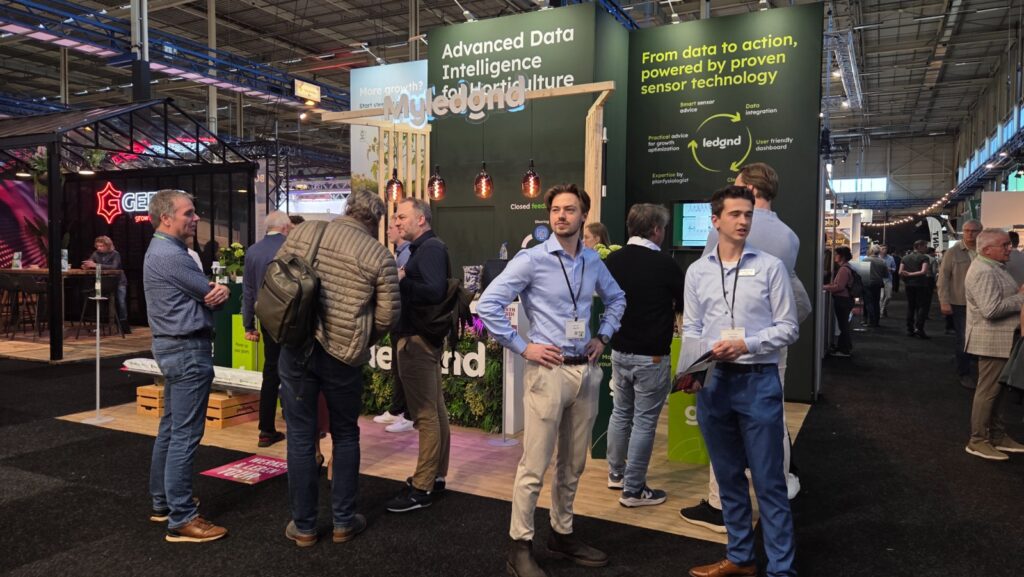
GreenTech Amsterdam 2026
From 9 to 11 June 2026, RAI Amsterdam will be all about GreenTech, the international trade fair for the horticulture sector. Professionals from around the world will come together to share knowledge a…
HortiContact 2026 Recap
Ledgnd Reflects on a Successful Edition of HortiContact 2026 HortiContact 2026 at Evenementenhal Gorinchem once again served as a meeting place for the Dutch greenhouse horticulture sector. Ledgnd loo…
Read more
Ledgnd x HortiSoccer World Cup Pool 2026 brings the horticultural industry together
With the launch of the renewed Ledgnd x HortiSoccer World Cup Pool 2026, people working across the horticultural industry once again get the chance to compete against each other during the FIFA World…
GreenTech Amsterdam 2026
From 9 to 11 June 2026, RAI Amsterdam will be all about GreenTech, the international trade fair for the horticulture sector. Professionals from around the world will come together to share knowledge a…
HortiContact 2026 Recap
Ledgnd Reflects on a Successful Edition of HortiContact 2026 HortiContact 2026 at Evenementenhal Gorinchem once again served as a meeting place for the Dutch greenhouse horticulture sector. Ledgnd loo…
Do you want to know more?
Interested in what Ledgnd can do for you? Leave your phone number, and we will contact you as soon as possible for a non-binding informational conversation


