Data from the Greenhouse: Photosynthetic Efficiency (Light Deviation) – Part 3
In this article, we delve deeper into light deviation and how this value helps us validate the balance between light intensity and photosynthetic efficiency. Using data from MyLedgnd, we analyze whether we can identify and prevent stress moments in the crop. Specifically, we focus on the period from September 3 to 5, during which we gained valuable insights into how the crop responds to variations in light intensity.
In our column ‘Data from the Greenhouse,’ we showcase the possibilities of utilizing greenhouse data. Through practical examples, we explain how data analysis can provide deeper insights into your crop and climate. We also offer tools to help you analyze and interpret your own data. In this article, we discuss an example of Light Deviation from a Phalaenopsis grower.
Crop
Phalaenopsis/Divers
Season
Summer/beginning of autumn
Sensors
What is Light Deviation?
Why is validating light deviation important?
Validating light deviation helps us identify moments when the crop is experiencing excessive stress. This is crucial because stress can reduce the plant’s ability to photosynthesize efficiently. By monitoring light deviation, we can easily determine whether a drop in photosynthesis efficiency is a normal fluctuation or an issue that requires intervention, such as reducing light intensity through shading.
Graph Analysis
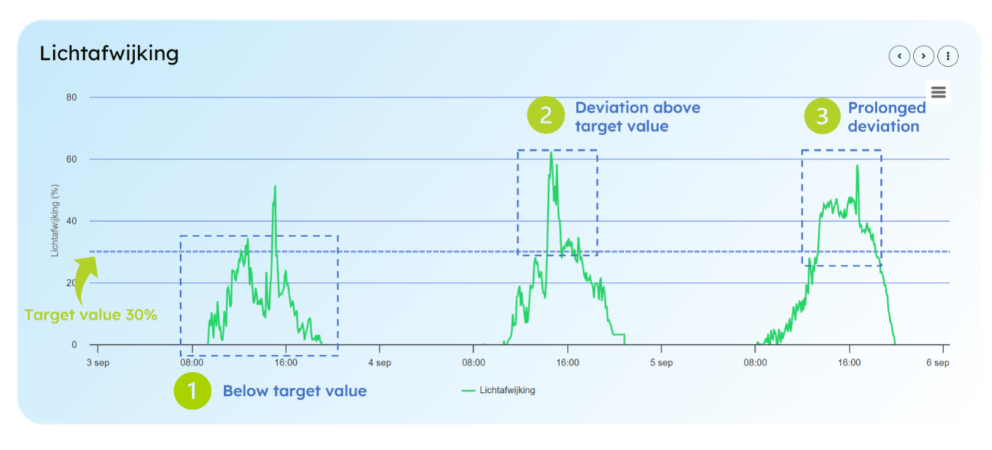
Graph 1
On September 3, we see in Graph 1 (point 1) that the light deviation largely stays below the target value. There is a brief moment around 3:00 PM where the value slightly exceeds the target. However, this is too short a duration (only 15 minutes) to warrant active intervention. The fluctuation was likely caused by a temporary stress event, such as a sudden spike in light intensity. No immediate action was necessary on this day.
In the same graph, on September 4 at point 2, we see that the light deviation exceeds the 30% target value from 2:15 PM to 3:30 PM. This period lasted over an hour (75 minutes), indicating that intervention might have been necessary. In this case, it would have been wise to implement shading, as the plant had to process higher light intensity for an extended time. This suggests a potential stress moment for the plant.
On September 5, we also observe an increased light deviation in Graph 1 (point 3). Compared to September 4, the deviation was less pronounced but persisted for a longer period. The light deviation remained above 30% from 1:20 PM to 6:00 PM. Although the deviation was lower, its sustained nature suggests constant stress for the plant. Intervention could have been implemented earlier in the day by initiating shading.
How do we validate the data from the light deviation graph?
It is always wise to validate Light Deviation data using other indicators. We recommend doing this through the following methods:
- Physical plant observations: Look for visible signs of stress, such as drooping leaves. Discoloration or other abnormalities in leaf structure can also indicate stress. Keep in mind that these signs can vary depending on the crop.
- Check for decreased photosynthesis nighttime values: Verify whether a specific stress moment is also reflected in a lower photosynthesis nighttime value.
Check based on photosynthesis efficiency nighttime values
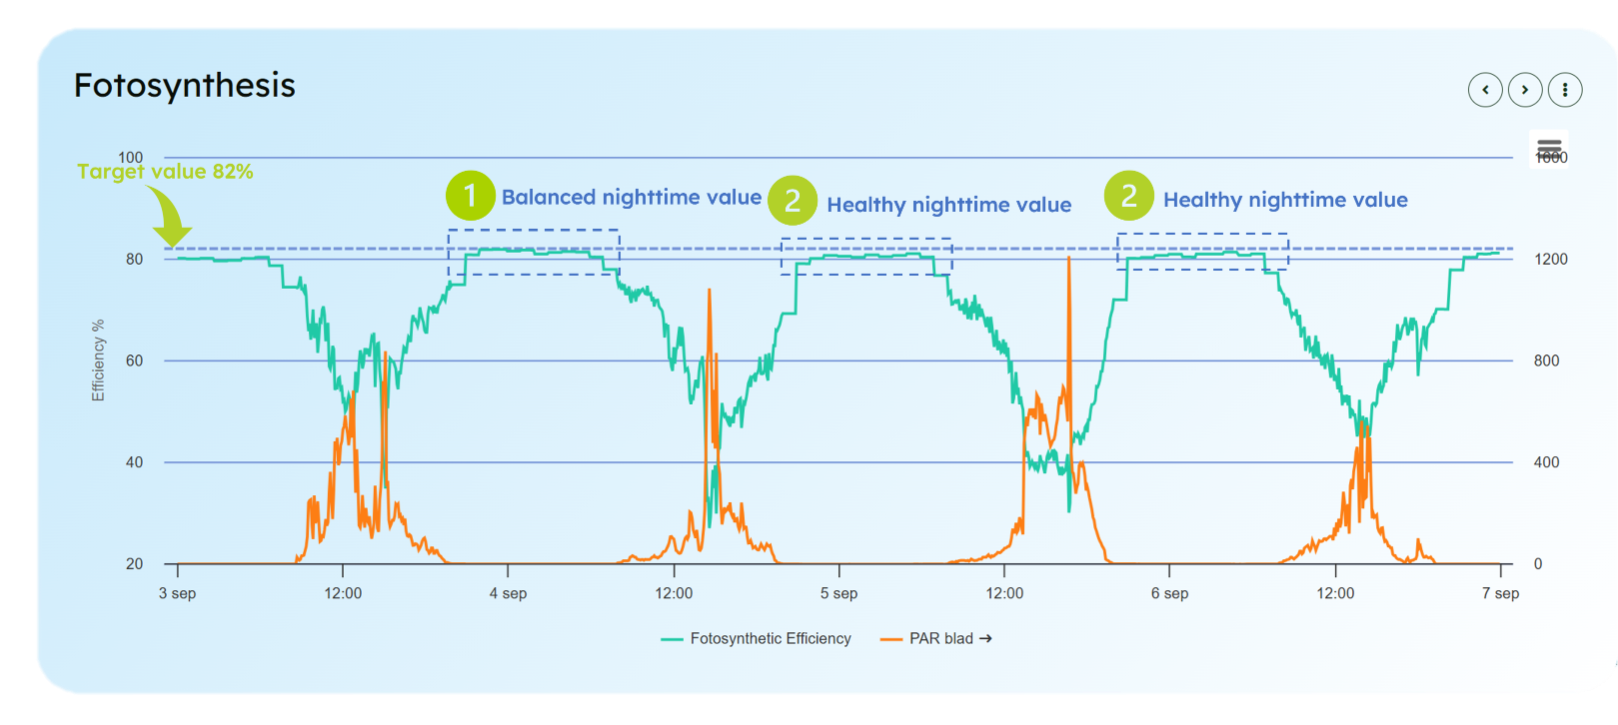
Graph 2
In Graph 2 (point 1), we see that during the night of September 3 to 4, the photosynthesis efficiency stays neatly around the target value of 82%. Similarly, during the nights of September 5 and 6 (point 2), the nighttime value slightly drops below the target value but not significantly enough to cause serious concern, as it remains above 80%. The Photosynthesis Efficiency graph shows that the values consistently stayed between 80%-82% across all days. This indicates that the plant did not suffer damage, as it managed to recover to a healthy target value during the night.
The earlier advice to implement shading on September 4, and particularly on September 5, can now be adjusted based on this finding, as we’ve determined that the plant did not experience a high level of stress.
These observations highlight the importance of analyzing multiple data sources before deciding to shade (or take other control actions in the greenhouse). Never rely on a single graph or value; always implement a verification mechanism when analyzing data!
Conclusion
This analysis demonstrates that light deviation is a valuable tool for identifying potential stress moments. However, it is essential not to rely on a single value or graph alone. Combining various data sources and assessing the physical condition of the crop is always recommended before taking action. By intelligently utilizing the data from MyLedgnd and carefully monitoring the crop, we can ensure the plants remain healthy and perform optimally.
New articles
Ledgnd x HortiSoccer World Cup Pool 2026 brings the horticultural industry together
With the launch of the renewed Ledgnd x HortiSoccer World Cup Pool 2026, people working across the horticultural industry once again get the chance to compete against each other during the FIFA World…
GreenTech Amsterdam 2026
From 9 to 11 June 2026, RAI Amsterdam will be all about GreenTech, the international trade fair for the horticulture sector. Professionals from around the world will come together to share knowledge a…
HortiContact 2026 Recap
Ledgnd Reflects on a Successful Edition of HortiContact 2026 HortiContact 2026 at Evenementenhal Gorinchem once again served as a meeting place for the Dutch greenhouse horticulture sector. Ledgnd loo…
Read more
Ledgnd x HortiSoccer World Cup Pool 2026 brings the horticultural industry together
With the launch of the renewed Ledgnd x HortiSoccer World Cup Pool 2026, people working across the horticultural industry once again get the chance to compete against each other during the FIFA World…
GreenTech Amsterdam 2026
From 9 to 11 June 2026, RAI Amsterdam will be all about GreenTech, the international trade fair for the horticulture sector. Professionals from around the world will come together to share knowledge a…
HortiContact 2026 Recap
Ledgnd Reflects on a Successful Edition of HortiContact 2026 HortiContact 2026 at Evenementenhal Gorinchem once again served as a meeting place for the Dutch greenhouse horticulture sector. Ledgnd loo…
Do you want to know more?
Interested in what Ledgnd can do for you? Leave your phone number, and we will contact you as soon as possible for a non-binding informational conversation


