Data from the Greenhouse: RTR
In greenhouse horticulture, it’s crucial to find the right balance between light and temperature to create optimal growing conditions for crops. In this article, we examine a recent case involving chrysanthemums where the RTR value (daily temperature divided by the sum of light) fell outside the desired range. We discuss what these values mean, the causes behind the deviation, and the adjustments made to improve the balance.
In our ‘Data from the Greenhouse’ series, we showcase the possibilities of using greenhouse data. Through practical examples, we explain how data analysis can provide deeper insights into your crops and climate. We offer you the tools to analyze and interpret your own data. In this article, we discuss an example of the RTR from a chrysanthemum grower.
What is an RTR Value?
RTR, or Ratio Temperature to Radiation, is a crucial parameter in greenhouse horticulture. It represents the ratio between the temperature in the greenhouse and the amount of light the crop receives. Light is defined here as the total light sum, also known as DLI (Daily Light Integral), that the crop receives. In other words, RTR indicates how well the available light level in the greenhouse aligns with the temperature, which directly affects the growth rate and balance of the plants.
Analysis of the RTR value
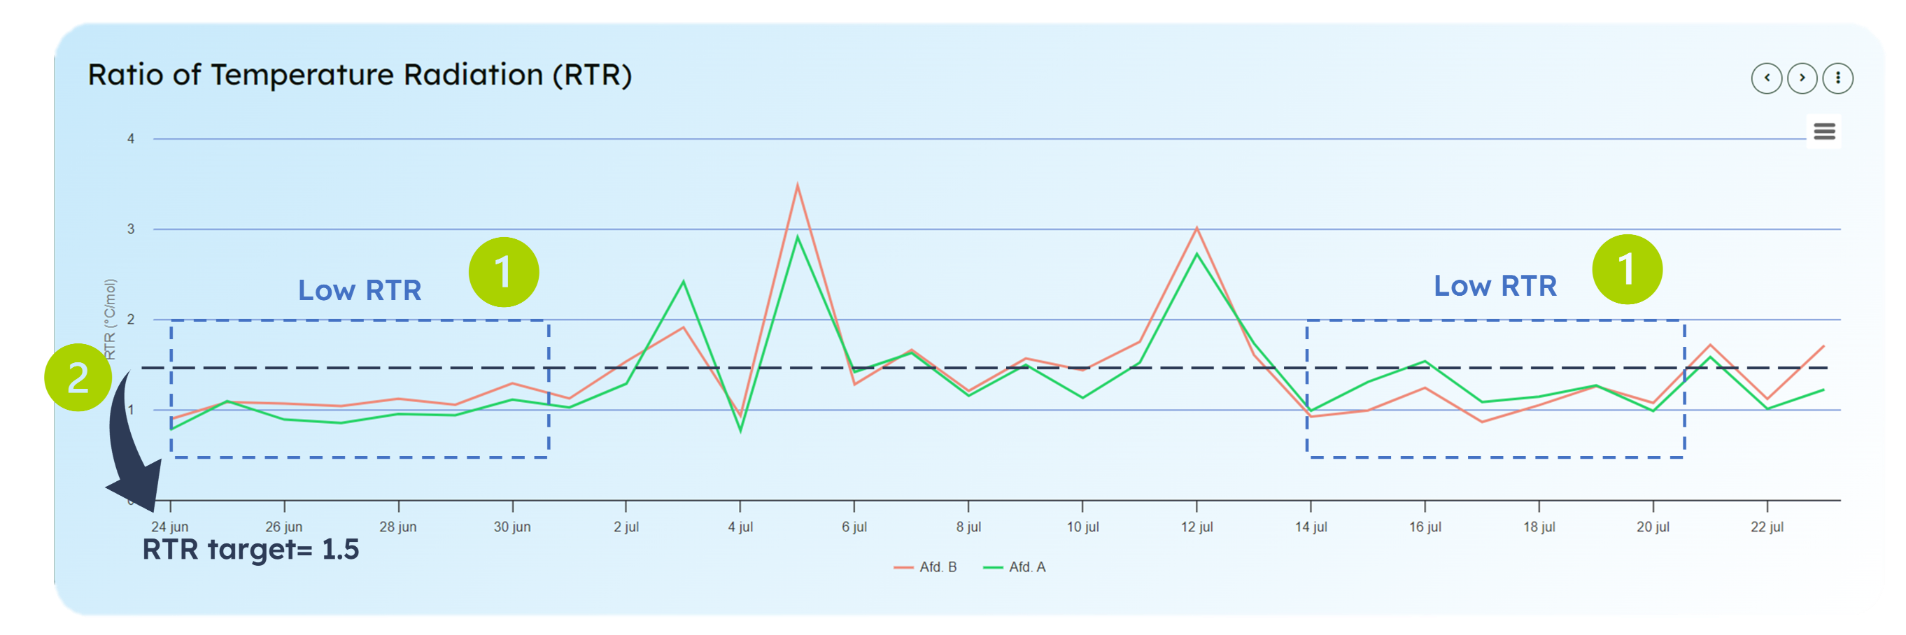
The RTR value is a key indicator of the efficiency of the light and temperature ratio in the greenhouse. In the case of the chrysanthemum grower, a significant drop in the RTR value was noticed during the periods of June 24 to June 31 and July 14 to July 23 (number 1 in the image). The measured values were consistently below the target of 1.5 (number 2 in the image). This indicates a situation where the temperature in the greenhouse was relatively low compared to the amount of light the plants received during that period. This is a static target value, but ideally, if possible, we prefer to work with a dynamic RTR target value. Our dynamic target is calculated solely based on the achieved daily temperature, which then determines the ideal RTR. We will elaborate more on this in a future post.
Cause of low RTR value
An RTR value around 1 suggests that the greenhouse temperature isn’t warming sufficiently in relation to the light exposure. This can lead to an overproduction of sugars. The plant needed more warmth to utilize the sugars it produced for growth. During the periods from June 24 to June 31 and from July 14 to July 23 (number 1 in the image), the greenhouse temperature was not optimal for the amount of available light, resulting in a lower RTR value.
Original strategy
The original strategy focused on achieving a compact plant. This was accomplished by venting the greenhouse early in the morning. By cooling the greenhouse in the early morning, a more compact growth form was stimulated. While this method was effective for producing a compact plant, it had the downside of relatively low temperatures, which caused lower RTR values. This negatively impacted the efficiency of photosynthesis and overall plant growth.
Strategy for Improving the RTR Value
To increase the RTR and optimize chrysanthemum growth, the air management strategy was adjusted in this case. The new approach involved reducing early venting and keeping the windows closed for a longer period. This allowed the greenhouse temperature to rise more quickly, increasing the daily temperature. By keeping the windows closed for longer, the CO2 concentration in the greenhouse could also be maintained at higher levels, which is a critical factor for photosynthesis and plant growth.
Conclusion
Optimizing the RTR value requires careful coordination of temperature, light, and CO2 concentration. By adjusting the strategies and ensuring a higher daily temperature and consistent CO2 levels, the RTR value can approach the ideal target of 1.5. These adjustments not only improve growing conditions for chrysanthemums but also contribute to a more efficient production process in the greenhouse. With the insights gained from the data and the changes made, the grower can now focus on optimizing for better results. This case highlights the importance of continuous monitoring and adjustment in greenhouse horticulture to achieve optimal growth conditions.
New articles
Ledgnd x HortiSoccer World Cup Pool 2026 brings the horticultural industry together
With the launch of the renewed Ledgnd x HortiSoccer World Cup Pool 2026, people working across the horticultural industry once again get the chance to compete against each other during the FIFA World…
GreenTech Amsterdam 2026
From 9 to 11 June 2026, RAI Amsterdam will be all about GreenTech, the international trade fair for the horticulture sector. Professionals from around the world will come together to share knowledge a…
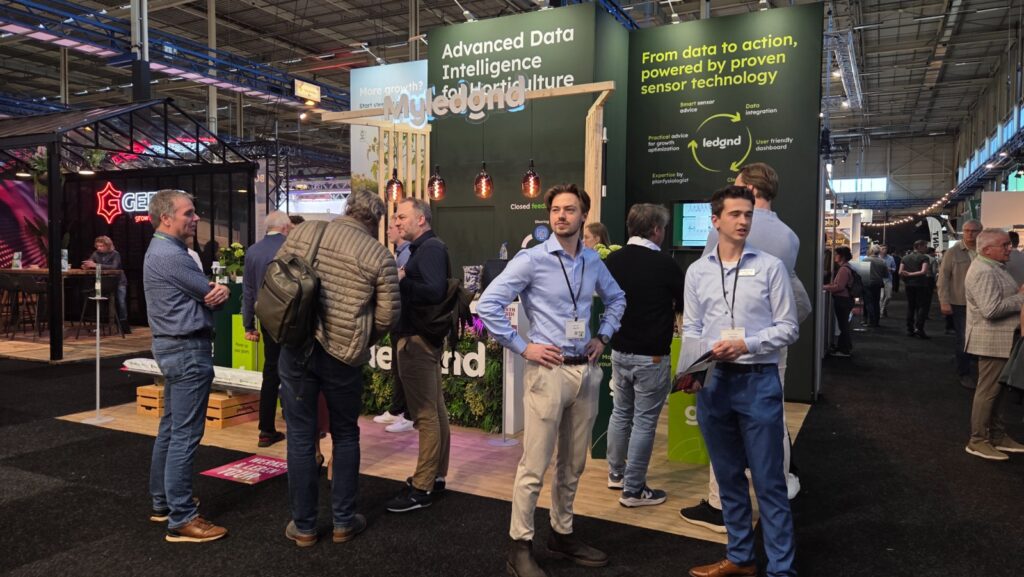
HortiContact 2026 Recap
Ledgnd Reflects on a Successful Edition of HortiContact 2026 HortiContact 2026 at Evenementenhal Gorinchem once again served as a meeting place for the Dutch greenhouse horticulture sector. Ledgnd loo…
Read more
Ledgnd x HortiSoccer World Cup Pool 2026 brings the horticultural industry together
With the launch of the renewed Ledgnd x HortiSoccer World Cup Pool 2026, people working across the horticultural industry once again get the chance to compete against each other during the FIFA World…
GreenTech Amsterdam 2026
From 9 to 11 June 2026, RAI Amsterdam will be all about GreenTech, the international trade fair for the horticulture sector. Professionals from around the world will come together to share knowledge a…
HortiContact 2026 Recap
Ledgnd Reflects on a Successful Edition of HortiContact 2026 HortiContact 2026 at Evenementenhal Gorinchem once again served as a meeting place for the Dutch greenhouse horticulture sector. Ledgnd loo…
Do you want to know more?
Interested in what Ledgnd can do for you? Leave your phone number, and we will contact you as soon as possible for a non-binding informational conversation


