Invisible plant stress Part II – How VPD helps detect early stress
In the greenhouse, everything may look green and healthy. However, sometimes there’s a hidden problem that’s barely visible to the naked eye: plant stress. Stress that doesn’t show immediately but still significantly impacts the growth, health, and yield of your crop.
We previously published an article about invisible plant stress: What your plant is trying to tell you (but you don’t see). In this article, we dive deeper into the topic of invisible plant stress, focusing on VPD (Vapour Pressure Deficit). Although it may seem like a simple number, VPD carries crucial information about your plant’s health.
What is VPD (Vapour Pressure Deficit)?
VPD (Vapour Pressure Deficit) indicates how much additional water vapour the air can absorb. It determines the rate of evaporation from the leaf, which influences the speed of:
-
Leaf cooling
-
Water transport from the roots
-
Nutrient uptake (e.g., calcium)
-
CO₂ absorption through the stomata (essential for photosynthesis)
The Ideal VPD Balance
For most crops, the ideal VPD range is between 0.8 and 1.2 kPa. This range allows the plant to evaporate sufficiently to absorb nutrients and CO₂ efficiently. Stomata remain open, enabling optimal photosynthesis.
Too high VPD (> 2.0 kPa):
-
The plant evaporates too quickly → stress
-
Stomata close to prevent dehydration
-
Result: reduced evaporation, rising leaf temperature, lower CO₂ uptake, and decreased photosynthesis
Too low VPD (< 0.2 kPa):
-
The air is saturated with moisture → minimal plant evaporation
-
Result: poor calcium transport and increased risk of physiological disorders
Practical example
During a summer period, a grower noticed that growth in one section of the greenhouse lagged, despite no visible disease or abnormalities. The plant color appeared normal, and leaves weren’t drooping, yet production was falling behind. The question arose: could invisible stress be the cause?
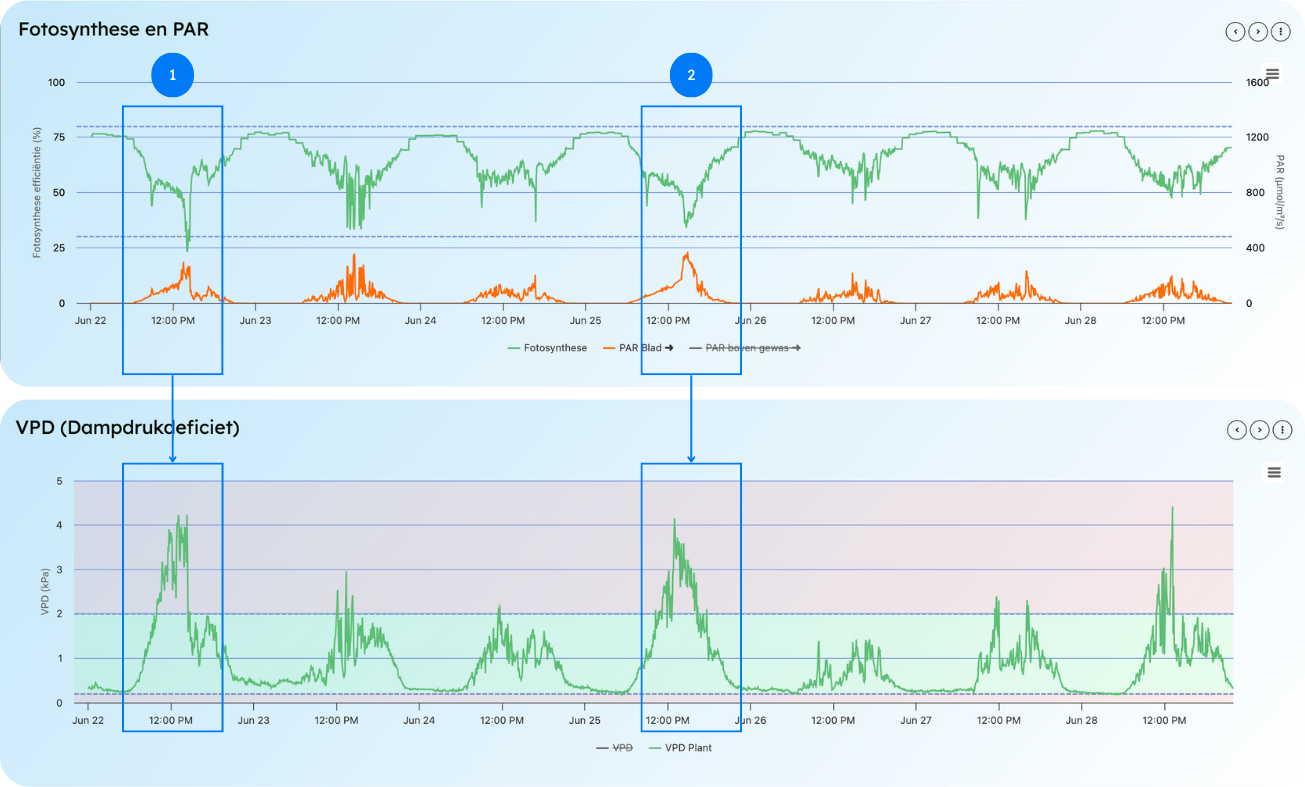
Data Used
In the two graphs above, three values are shown:
-
Photosynthesis Efficiency – indicates how effectively the plant converts light into energy
-
PAR Data (at leaf level) – shows how much light the plant can use for photosynthesis
-
VPD – as explained above
What Do the Graphs Show?
On June 22 (1) and June 25 (2), the VPD graph shows an increase in vapour pressure deficit. In the graph combining photosynthesis efficiency and PAR values, we observe a decline in photosynthesis efficiency on June 22, while the PAR value increases.
A higher PAR value means more light is hitting the leaf, which raises the leaf temperature. This increase stimulates the plant’s evaporation. However, as the plant evaporates more, it begins to lose water rapidly, causing the stomata to close. When this happens, CO₂ uptake drops, which in turn lowers photosynthesis efficiency.
In summary: Evaporative stress can lead to a decline in photosynthesis efficiency.
Want to understand how your plants are really feeling?
The example above shows how easy it is to detect invisible plant stress. Would you like to get started with this as well? Contact us for a free introduction.
Whitepaper How to Recognize Invisible Plant Stress
Growers who steer based on data, achieve better yields and save costs at the same time.
Our latest whitepaper shows how top growers use sensors and MyLedgnd to detect stress early and manage crop health more effectively.
In this whitepaper you will learn:
- Practical case studies of invisible plant stress
- The different types of plant stress
- Which stress signals you might be missing
- The consequences of stress and how to prevent it
Download the whitepaper and discover how your crop is really performing.
New articles
Ledgnd x HortiSoccer World Cup Pool 2026 brings the horticultural industry together
With the launch of the renewed Ledgnd x HortiSoccer World Cup Pool 2026, people working across the horticultural industry once again get the chance to compete against each other during the FIFA World…
GreenTech Amsterdam 2026
From 9 to 11 June 2026, RAI Amsterdam will be all about GreenTech, the international trade fair for the horticulture sector. Professionals from around the world will come together to share knowledge a…
HortiContact 2026 Recap
Ledgnd Reflects on a Successful Edition of HortiContact 2026 HortiContact 2026 at Evenementenhal Gorinchem once again served as a meeting place for the Dutch greenhouse horticulture sector. Ledgnd loo…
Read more
Ledgnd x HortiSoccer World Cup Pool 2026 brings the horticultural industry together
With the launch of the renewed Ledgnd x HortiSoccer World Cup Pool 2026, people working across the horticultural industry once again get the chance to compete against each other during the FIFA World…
GreenTech Amsterdam 2026
From 9 to 11 June 2026, RAI Amsterdam will be all about GreenTech, the international trade fair for the horticulture sector. Professionals from around the world will come together to share knowledge a…
HortiContact 2026 Recap
Ledgnd Reflects on a Successful Edition of HortiContact 2026 HortiContact 2026 at Evenementenhal Gorinchem once again served as a meeting place for the Dutch greenhouse horticulture sector. Ledgnd loo…
Do you want to know more?
Interested in what Ledgnd can do for you? Leave your phone number, and we will contact you as soon as possible for a non-binding informational conversation


