Heatmap brings data to life
MyLedgnd has been updated with several new and improved apps. One of the key improvements is the heatmap feature. Where sensor data was previously shown mainly in graphs and tables, the heatmap now brings the numbers to life in an intuitive colour map.
Visualisation
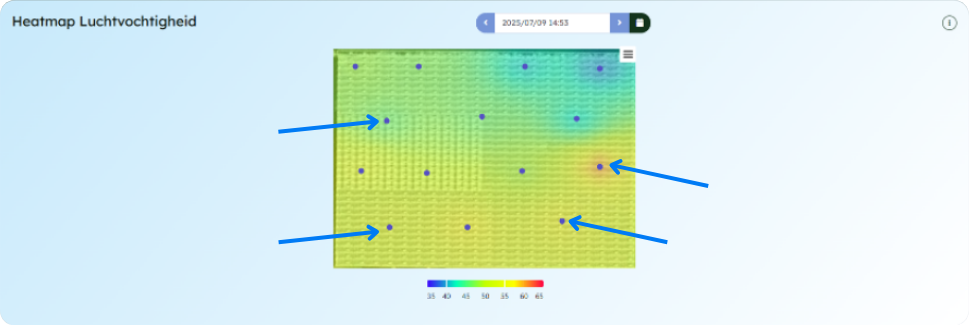
The heatmap visualises various types of data such as temperature, humidity and other climate information on a scaled layout of the greenhouse. The colour scheme allows you to instantly see where climate values deviate. By showing sensor positions as blue dots on the map, it also becomes clear in which zones measurements are taking place and which areas fall between two sensor points.
Historical and realtime data
Users can switch between real-time data and historical moments. Want to know how the temperature on Monday morning at 06:00 compares to yesterday or last week? With a single click you select the date and time, and the heatmap is instantly rebuilt. This makes it possible to track trends and evaluate the effects of interventions such as extra ventilation or shading afterwards.
Heatmap temperature
In the image below we see an example of a heatmap showing the temperature inside the greenhouse. Blue areas indicate lower values and lower temperatures, while red points to higher temperatures.
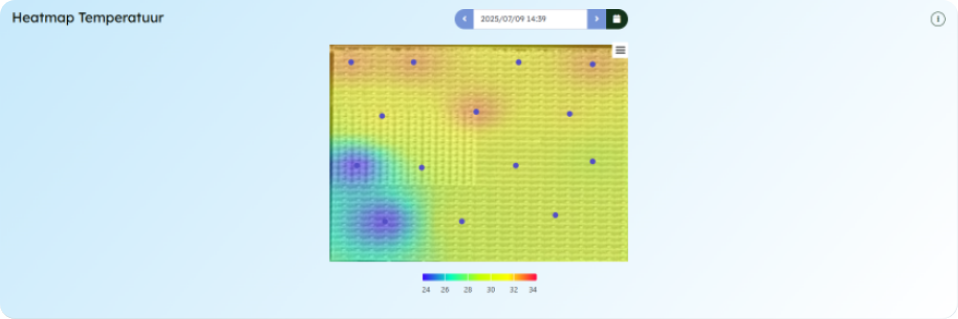
In this greenhouse the temperature heatmap showed two blue patches in the afternoon, indicating cooler air currents along the outer wall. Upon inspection it turned out that the sliding door was not fully closed. After closing the door, the greenhouse temperature evened out again within minutes. Without the heatmap, this leakage would likely have gone unnoticed that day.
Valuable insights for targeted control
With the heatmap the grower has constant access to real-time and historical climate data, allowing quick detection of anomalies and precise intervention. Below are some key benefits of this tool for targeted climate control in the greenhouse:
Quick overview
Within seconds you can see where action is needed without scrolling through endless data tables.
Targeted adjustments
Local hotspots or cold zones are immediately visible, allowing more precise control with ventilation, screening or irrigation.
Efficiency and control
By detecting deviations early you reduce energy loss, support plant health and increase yield.
Fast diagnosis
See at a glance whether a sensor might be faulty or if a climate measure is not having the intended effect.
Conclusion
With the improved heatmap functionality in MyLedgnd growers have a powerful tool to detect climate variations early and take immediate action. The heatmap integrates seamlessly with other visualisations within the platform, bringing all relevant climate data together in a clear and structured way. This makes it easy to take steps toward a more energy-efficient and productive greenhouse operation. Want to experience what the heatmap can do for your business? Fill in the form below and we will contact you within two working days.
New articles
Ledgnd x HortiSoccer World Cup Pool 2026 brings the horticultural industry together
With the launch of the renewed Ledgnd x HortiSoccer World Cup Pool 2026, people working across the horticultural industry once again get the chance to compete against each other during the FIFA World…
GreenTech Amsterdam 2026
From 9 to 11 June 2026, RAI Amsterdam will be all about GreenTech, the international trade fair for the horticulture sector. Professionals from around the world will come together to share knowledge a…
HortiContact 2026 Recap
Ledgnd Reflects on a Successful Edition of HortiContact 2026 HortiContact 2026 at Evenementenhal Gorinchem once again served as a meeting place for the Dutch greenhouse horticulture sector. Ledgnd loo…
Read more
Ledgnd x HortiSoccer World Cup Pool 2026 brings the horticultural industry together
With the launch of the renewed Ledgnd x HortiSoccer World Cup Pool 2026, people working across the horticultural industry once again get the chance to compete against each other during the FIFA World…
GreenTech Amsterdam 2026
From 9 to 11 June 2026, RAI Amsterdam will be all about GreenTech, the international trade fair for the horticulture sector. Professionals from around the world will come together to share knowledge a…
HortiContact 2026 Recap
Ledgnd Reflects on a Successful Edition of HortiContact 2026 HortiContact 2026 at Evenementenhal Gorinchem once again served as a meeting place for the Dutch greenhouse horticulture sector. Ledgnd loo…
Do you want to know more?
Interested in what Ledgnd can do for you? Leave your phone number, and we will contact you as soon as possible for a non-binding informational conversation


