Data from the Greenhouse: FE in the Tomato Cultivation – Part 4
In the pursuit of optimization in greenhouse horticulture, photosynthesis efficiency (PE) plays a crucial role. This article focuses on a case study from tomato cultivation. It explores how adjustments in lighting strategies within the greenhouse can contribute to higher photosynthesis efficiency, reduced crop stress, and ultimately improved growth and yield of tomatoes.
In our feature ‘Data from the Greenhouse’, we showcase what’s possible with greenhouse data. Using real-world examples, we explain how data analysis can give you deeper insight into your crop and climate. We provide practical tools to help you analyze and interpret your own data. In this article, we take a closer look at an example of Photosynthesis Efficiency at a tomato grower.
What is photosynthesis efficiency?
Photosynthesis efficiency indicates how effectively a plant converts the light it receives into sugars, the energy source it needs to grow. This process becomes especially important during winter, when natural sunlight is limited. The more efficiently a plant can convert light, the better it can build biomass and store energy. In such conditions, artificial lighting in the greenhouse becomes a crucial source of light.
If you want to learn more about this, read part 1, 2 en 3 on Photosynthesis Efficiency from the Data from the Greenhouse collection.
The situation
For this analysis, the following sensors were used: Sendot Sensor (FE and Leaf-Level PAR)
In this case, we analyzed the period from September 20 to 25. During these days, photosynthesis efficiency (FE) and photosynthetically active radiation (PAR) at the leaf level were measured using a PAR sensor. This sensor, specifically from Sendot, accurately measures the number of micromoles of photons per second hitting the leaf surface.
It’s important to note that the recorded PAR values may be lower than the actual incoming radiation, as the sensor is angled and measures directly on a leaf.
Analysis of the data
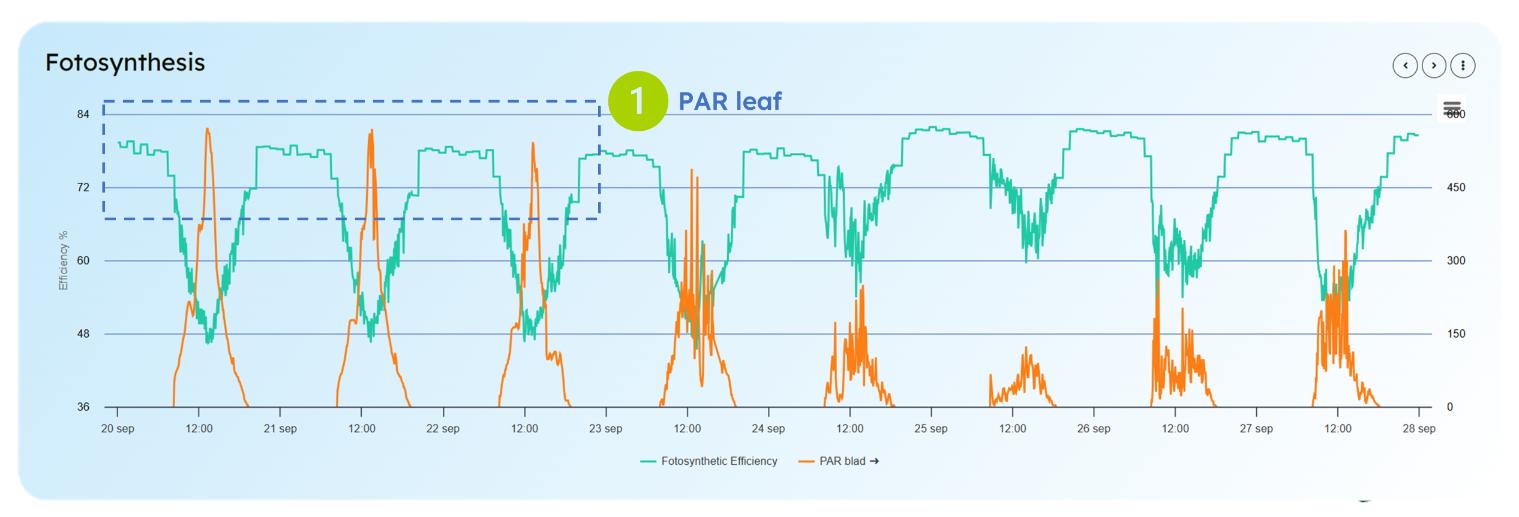
Graph 1
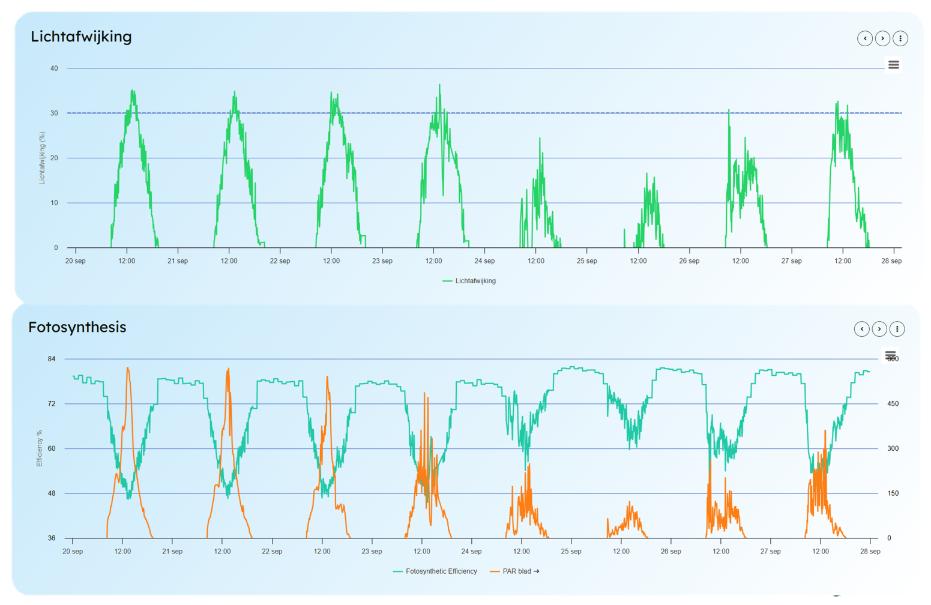
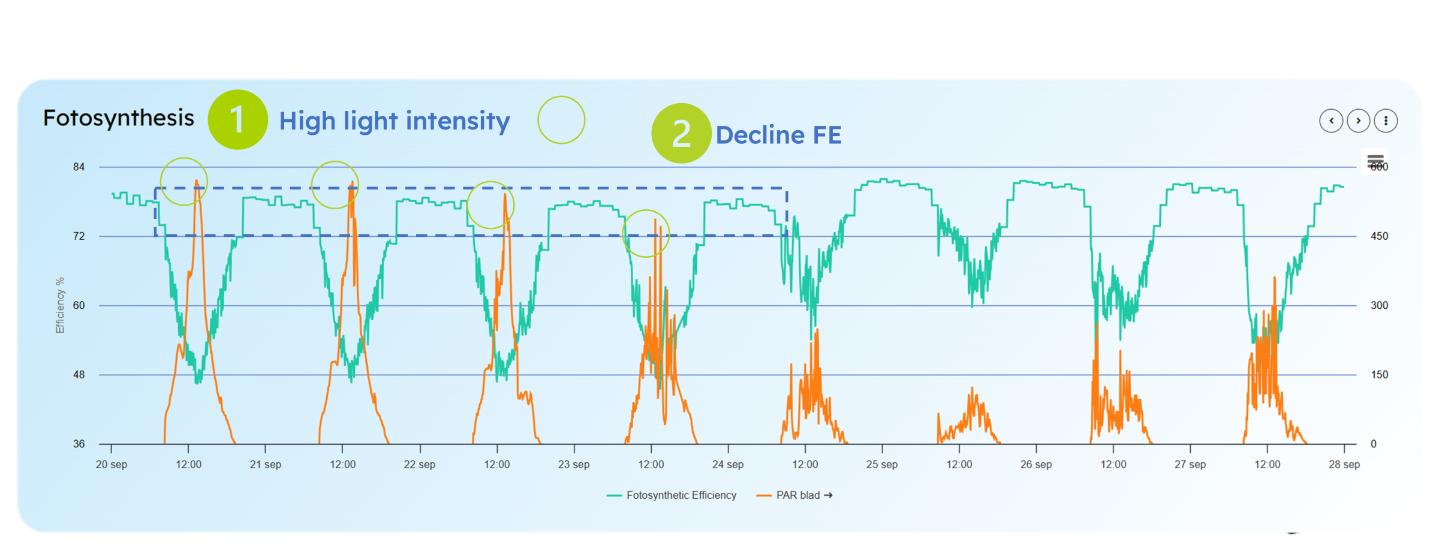
The graph above contains two lines. The orange line represents the amount of PAR measured at the leaf level, while the green line shows the photosynthesis efficiency. Looking at the period from September 20 to 23 (graph 1, section 1), we can see that the crop was exposed to a high amount of light. On average, the crop received 200 µmol/m²/s at leaf level, with peaks reaching nearly 600 µmol/m²/s at certain moments.
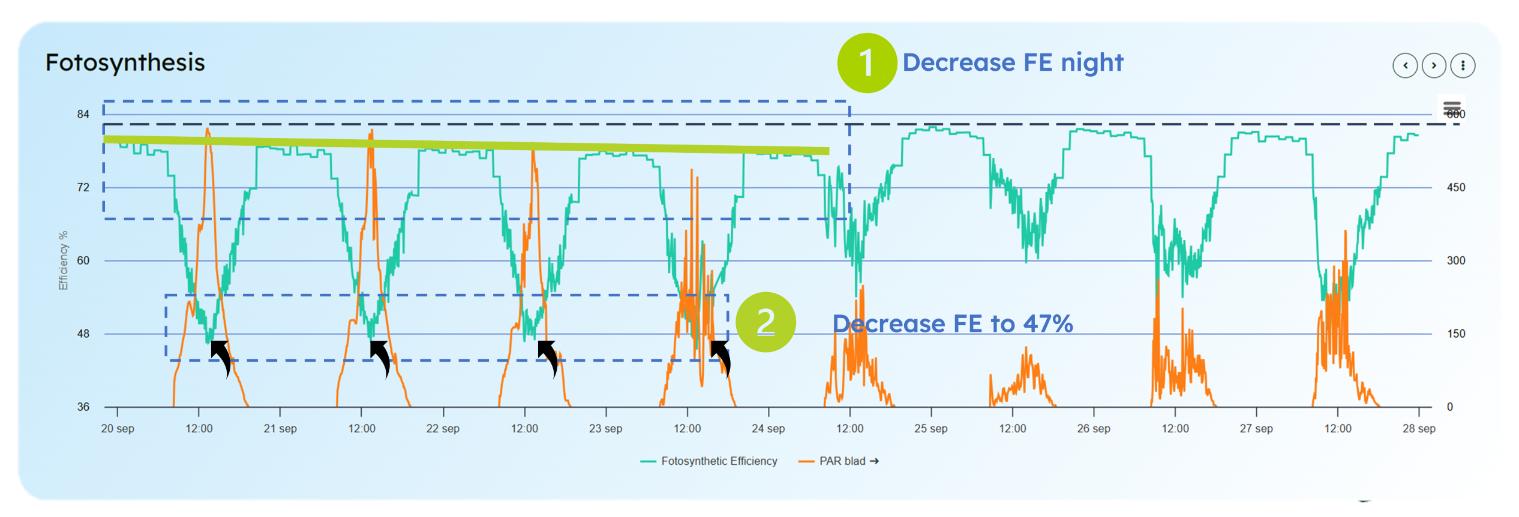
Graph 2
The target value for photosynthesis efficiency is typically around 82%. In graph 2 (section 1), we can see that the high light intensity caused the photosynthesis efficiency at night to gradually decrease in the following days, dropping to around 77%. At certain times during the day — most often around midday — photosynthesis efficiency dropped as low as 48%, as shown in graph section 2. This light stress led to a significant decline in efficiency, meaning that at times the plant was only able to convert about half of the available light into sugars.
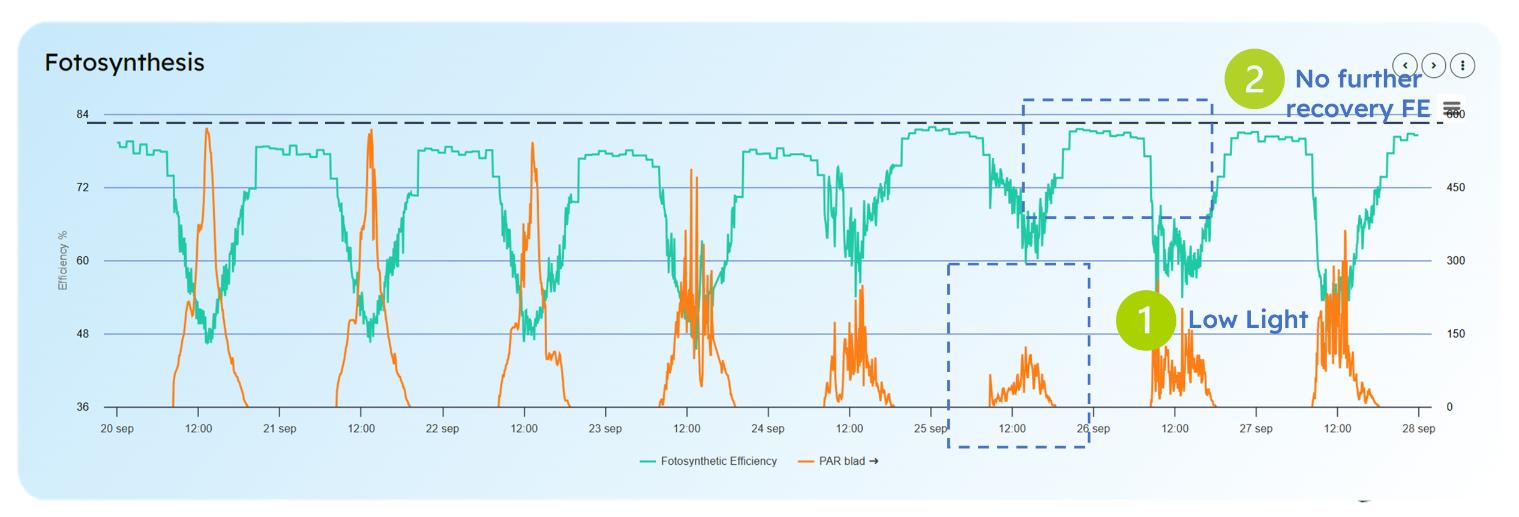
Graph 3
In graph 3 (section 1), we observe that September 24 and 25 were days with lower light levels. The light reaching the leaf surface peaked at 200 µmol/m²/s (*).
In graph 3 (section 2), we also see that during these nights, the photosynthesis efficiency rose again, returning to the target level of 82%. These lower-light days allowed the plant to recover. On the first day with less light (September 24), we already see a full recovery.
However, September 25 did not lead to further improvement, suggesting that the plants had already fully recovered the day before. As a result, potential growth may have been missed on the 25th, since the plants were no longer under stress and could have handled more light. The recommendation would have been to allow more light through, or, if possible, to increase supplemental lighting on September 25.
(*) The micromole values at leaf level are always lower than the actual incoming radiation on the crop. This is because the sensor clip is always positioned at an angle on the leaf.
Confirmation of the analysis
Can we confirm the above analysis using other data from the greenhouse?
Yes, we can. For this, we use the Light Deviation graph. Light Deviation represents the percentage difference from the optimal electron transport rate, also known as Electron Transport Rate (ETR).
ETR
ETR is a measure of the speed at which electrons are transported through the photosynthetic chain during photosynthesis. This rate is crucial because it indicates how efficiently the plant can convert light into energy, which is then used to produce sugars.
The target value for Light Deviation is 30%. A deviation above 30% is considered suboptimal and indicates a stress moment for the plant. Conversely, a maximum deviation below 20% suggests that the plant is not being challenged enough, the light intensity is too low for what the plant can handle. In that case, the plant could have tolerated more light at that moment.
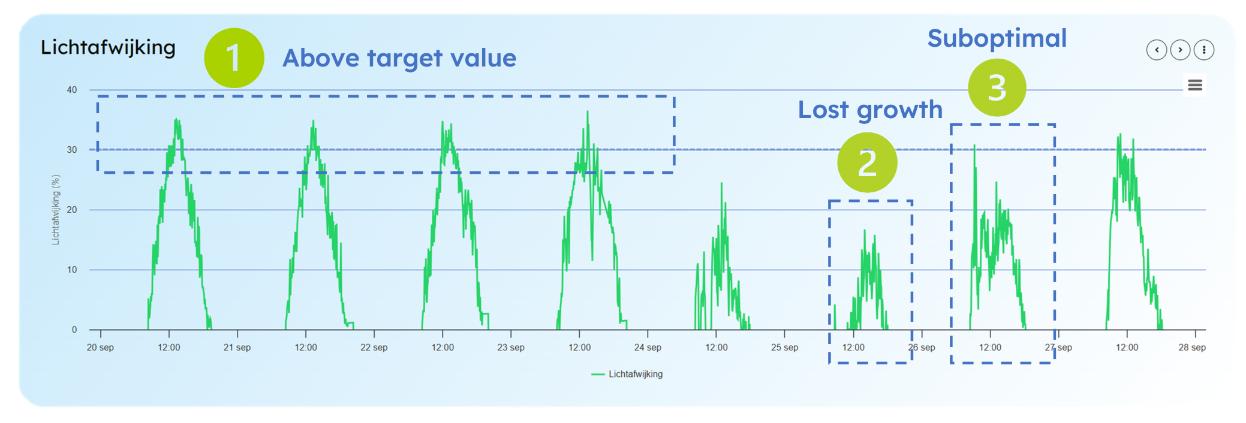
Graph 4
In graph 4, we see that from September 20 to 23 (marked as number 1), the light deviation follows a nice parabolic curve, but it remains above the target value of 30%. While the deviation isn’t extremely high, it’s just enough to cause damage and stress to the plant. On September 24, however, the plant is clearly able to make better use of the available light, which allows it to start recovering. The following day, September 25 (number 2), falls below 20%, but since recovery had already occurred, this lower value meant a missed opportunity for growth. On September 26 (number 3), the deviation briefly approaches 30%, but remains mostly under 20% due to dips in the graph, making it a suboptimal day overall.
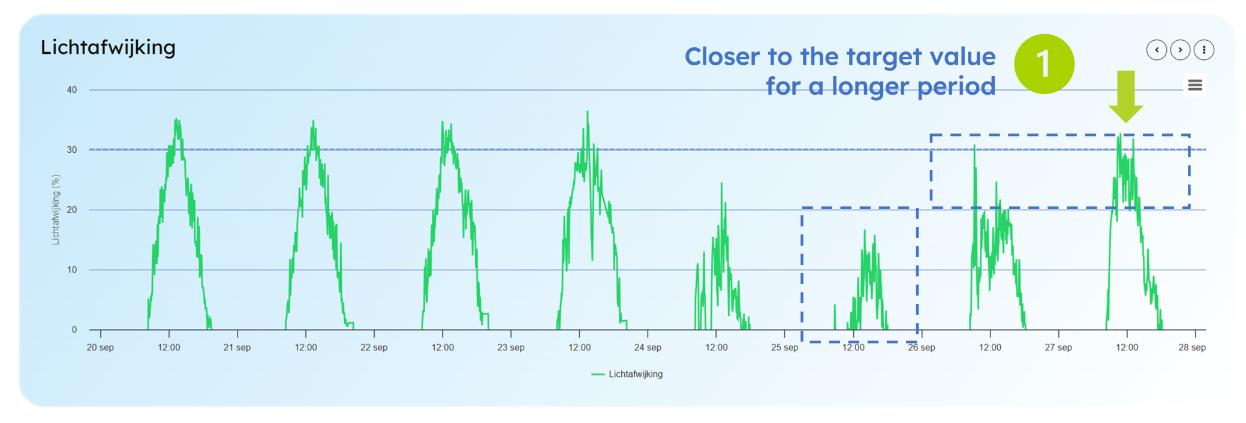
Graph 4.2
When comparing September 26 with September 27 (section 1), we see that September 27 shows a more ideal parabola and stays closer to the 30% target for a longer period. Our recommendation would be to create conditions similar to September 27 on September 25. That way, potential growth wouldn’t be missed, and the plant would be able to photosynthesize at an optimal level.
Graph 4.3
In the Light Deviation graph, you’ll notice values that appear almost like an inverted version of the green line (FE) from the photosynthesis efficiency graph. While the two graphs look very similar, the Light Deviation graph is not simply the inverse of the FE graph. This is because the Light Deviation calculation also includes leaf-level PAR (PARblad) as part of the formula. As a result, it provides a more comprehensive view that reflects not just photosynthesis efficiency, but also how the plant responds to the actual amount of light received at the leaf level. So, it tells us more than just the inverse of FE.
Prevent damage
Graph 5
The high light intensity from September 20 to 23 (section 1), with peaks reaching nearly 600 µmol/m²/s, caused light stress in the tomato plants. As a result, photosynthesis efficiency dropped to just 77% during the final night, compared to a healthy level of 82%. This indicates that the plant was unable to fully utilize the available light and was under stress.
During these days, ETR deviation also exceeded the target value of 30%, confirming that the plant received more light than it could effectively process without sustaining damage.
This stress could have been prevented by proactively managing the light intensity, especially during peak light moments around midday. For example, light could have been partially shaded during the highest peaks or in the final hour of the afternoon. By shading just that last hour, the plant can begin recovery sooner, without requiring an entire low-light day.
This way, you only “lose” one hour of light that would likely be used inefficiently anyway, rather than sacrificing a full day of potential growth. It’s comparable to sending an overworked employee home an hour early, rather than letting them burn out completely. A simple, fast, and highly effective preventative strategy.
Conclusion
The article concludes that a dynamic and balanced lighting strategy, where periods of intense lighting are alternated with phases of lower light intensity, is essential for maintaining stable and optimal photosynthesis efficiency. This approach helps reduce plant stress, supports recovery, and ultimately contributes to improved overall growth and yield.
New articles
Ledgnd x HortiSoccer World Cup Pool 2026 brings the horticultural industry together
With the launch of the renewed Ledgnd x HortiSoccer World Cup Pool 2026, people working across the horticultural industry once again get the chance to compete against each other during the FIFA World…
GreenTech Amsterdam 2026
From 9 to 11 June 2026, RAI Amsterdam will be all about GreenTech, the international trade fair for the horticulture sector. Professionals from around the world will come together to share knowledge a…
HortiContact 2026 Recap
Ledgnd Reflects on a Successful Edition of HortiContact 2026 HortiContact 2026 at Evenementenhal Gorinchem once again served as a meeting place for the Dutch greenhouse horticulture sector. Ledgnd loo…
Read more
Ledgnd x HortiSoccer World Cup Pool 2026 brings the horticultural industry together
With the launch of the renewed Ledgnd x HortiSoccer World Cup Pool 2026, people working across the horticultural industry once again get the chance to compete against each other during the FIFA World…
GreenTech Amsterdam 2026
From 9 to 11 June 2026, RAI Amsterdam will be all about GreenTech, the international trade fair for the horticulture sector. Professionals from around the world will come together to share knowledge a…
HortiContact 2026 Recap
Ledgnd Reflects on a Successful Edition of HortiContact 2026 HortiContact 2026 at Evenementenhal Gorinchem once again served as a meeting place for the Dutch greenhouse horticulture sector. Ledgnd loo…
Do you want to know more?
Interested in what Ledgnd can do for you? Leave your phone number, and we will contact you as soon as possible for a non-binding informational conversation


