Invisible plant stress Part I – What your plant is trying to tell you (but you don’t see)
As a grower you know better than anyone how important it is to observe what happens in the greenhouse. You look at leaf posture growth colour and rely on your experience to determine whether a plant is developing well. But what if your plant is trying to tell you something and you completely miss it?
In modern greenhouse horticulture it is increasingly clear that plants experience stress even before you see anything. They reduce their photosynthesis slow down stomatal activity or stop growing. And on the outside nothing seems wrong. In this article we show an example from practice of invisible stress. The plant looks perfect but is already under stress that will only become visible after a few days.
The importance of recognising invisible stress
By recognising invisible plant stress you can prevent damage. If you know the plant is struggling to evaporate at that moment you can take action by shading increasing humidity or reducing light. If you wait until you can see it you are often too late and it may cost you yield energy or quality.
Practical example of what you do not see but can measure
To gain insight into the invisible stress experienced by the crop we use a real-world example.
Situation sketch
This situation took place in a tomato greenhouse at the end of June.
The greenhouse conditions reflected standard daily practice with LED lighting ventilation and irrigation set to default settings.
Required data
To make the invisible stress visible we used photosynthesis efficiency and PAR data. The data was automatically collected and visualised in MyLedgnd.
Photosynthesis efficiency shows how well the plant converts light into energy.
PAR data at leaf level shows how much light the plant can use for photosynthesis.
These values show exactly how efficiently or inefficiently your plants are using their light.
The invisible stress
The sensor continuously tracks efficiency and compares it to the plant’s maximum light usage. In the graph below you can clearly see a stress peak when the deviation exceeded 40 percent light deviation. On the outside the plant still looked healthy but the data clearly shows a peak in stress.
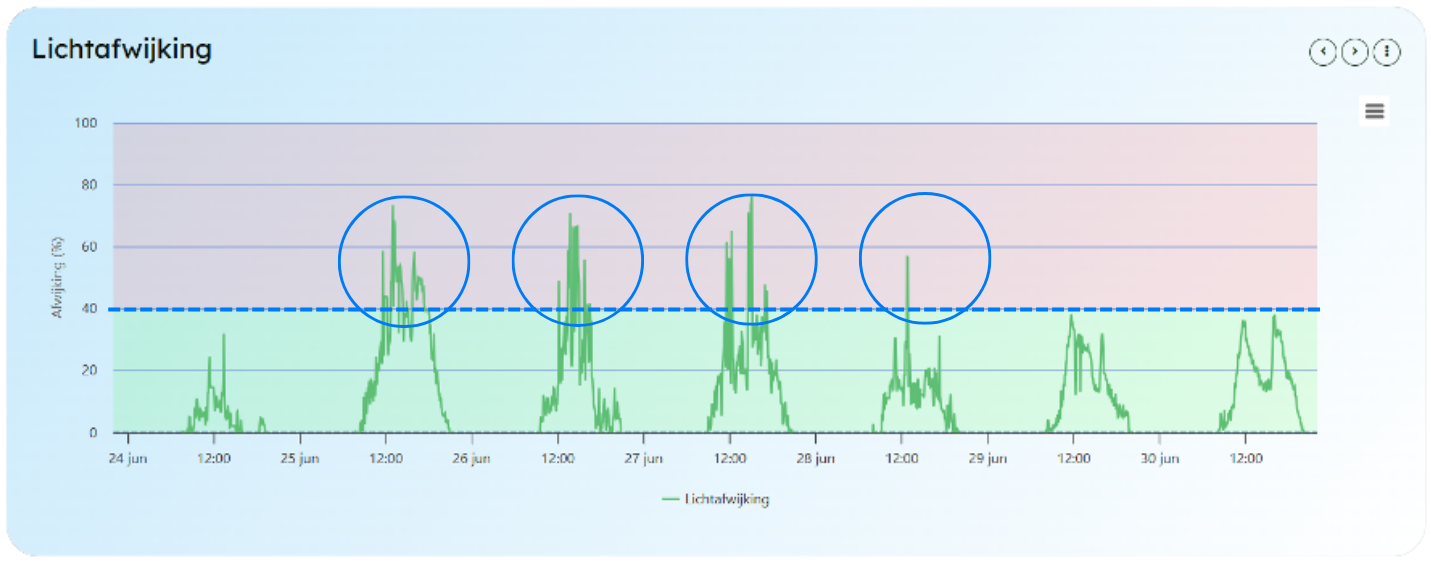
From 25 to 28 June you can see the light deviation rise above 40 percent. Deviations above 40 percent mean the plant is no longer using light efficiently. This not only wastes energy but also indicates damage to the plant’s photosystems. This kind of stress eventually affects growth resistance and yield.
This real-world example shows what happens when the plant can no longer convert light into energy effectively. The crop becomes stressed the lights are on for nothing and your energy bill goes up. With the real-time sensor data in MyLedgnd you can immediately spot this inefficiency and adjust the climate or lighting before it costs you yield and kilowatt hours.
Ready to get started with photosynthesis efficiency and MyLedgnd yourself?
MyLedgnd and our sensors fit in any greenhouse regardless of the crop. Would you like to discover the value of real-time plant data for your cultivation? Contact us for a no-obligation conversation. We translate measurement data into concrete actions that reduce your energy costs and increase your yield.
Whitepaper How to Recognize Invisible Plant Stress
Growers who steer based on data, achieve better yields and save costs at the same time.
Our latest whitepaper shows how top growers use sensors and MyLedgnd to detect stress early and manage crop health more effectively.
In this whitepaper you will learn:
- Practical case studies of invisible plant stress
- The different types of plant stress
- Which stress signals you might be missing
- The consequences of stress and how to prevent it
Download the whitepaper and discover how your crop is really performing.
New articles

Horticontact 2026
Weather conditions play a key role in the daily steering of the greenhouse. That is why the MyLedgnd data platform relies on reliable weather data from the KNMI. But how is this information actually g…
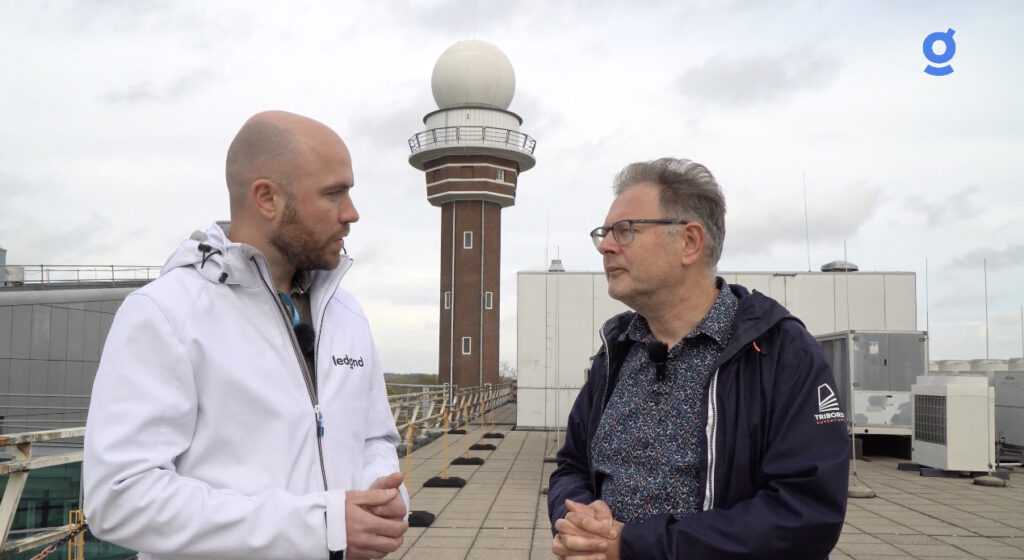
Video – Ledgnd visits the KNMI
Weather conditions play an important role in the daily steering of the greenhouse. That is why the MyLedgnd data platform uses reliable weather data from the KNMI. But how is this information actually…
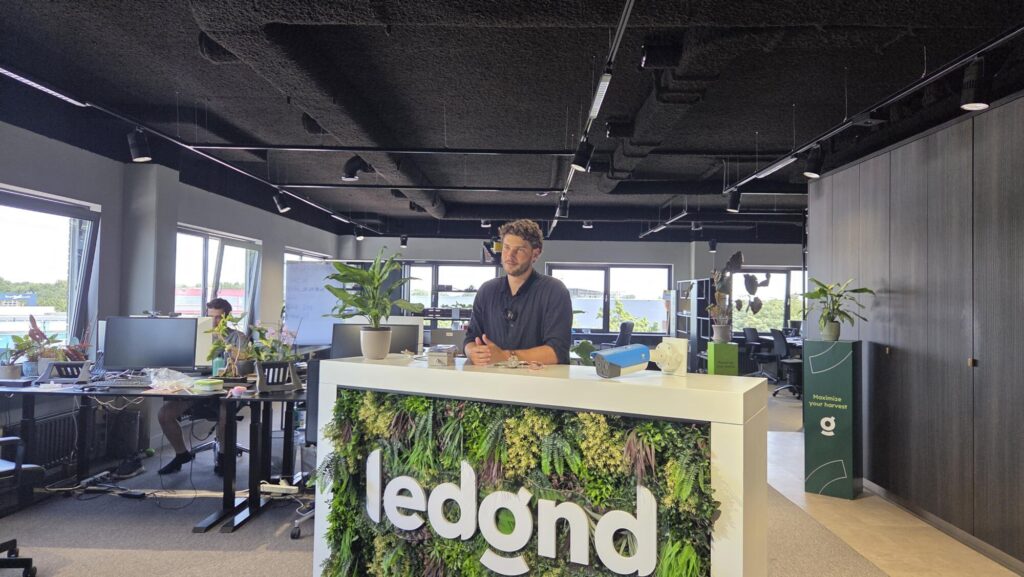
How 2025 became the year of plant feedback, sustainability and collaboration
2025 was a year of contrasts for many growers: rising costs and stricter regulations, while at the same time more opportunities than ever to gain control of the crop using data. At Ledgnd, the year wa…
Read more
Horticontact 2026
Weather conditions play a key role in the daily steering of the greenhouse. That is why the MyLedgnd data platform relies on reliable weather data from the KNMI. But how is this information actually g…
Video – Ledgnd visits the KNMI
Weather conditions play an important role in the daily steering of the greenhouse. That is why the MyLedgnd data platform uses reliable weather data from the KNMI. But how is this information actually…
How 2025 became the year of plant feedback, sustainability and collaboration
2025 was a year of contrasts for many growers: rising costs and stricter regulations, while at the same time more opportunities than ever to gain control of the crop using data. At Ledgnd, the year wa…
Do you want to know more?
Interested in what Ledgnd can do for you? Leave your phone number, and we will contact you as soon as possible for a non-binding informational conversation


