From climate to crop why plant science is the key to better cultivation decisions
In the greenhouse, everything revolves around creating the right conditions. Light, temperature, CO2 and humidity are all factors you measure, control and optimise. Traditionally, growers focus mainly on the climate itself. You adjust screens, lighting or ventilation to manage the indoor environment. This is called climate control based on physics. But more and more growers are shifting toward plant science, making decisions based on what the crop itself is showing. Why is that? Because the real question is not what is happening in the greenhouse, but how the crop is responding to it.
Physics looks at the environment. Plant science looks at the response.
When you set the temperature in your greenhouse to 21 degrees Celsius, that does not automatically mean the plant is comfortable. It may be evaporating more than is good for it. There may be too little CO2 for photosynthesis. Or the light intensity might be too high, causing the plant to reduce its efficiency.
The physical side of growing tells you what you are providing. The plant science side tells you whether it is actually working.
Imagine this: you increase the light intensity because it is sunny outside. From a physical point of view, everything seems fine. The temperature is stable and CO2 levels are on target. But when you look at photosynthesis efficiency, you suddenly see a drop. The plant is telling you, “I am getting too much light. I can no longer use the energy efficiently and I am becoming exhausted.” Without that plant science data, you would never have noticed this response, let alone been able to take action.
What do we measure in physics?
Physical measurements focus on the environmental factors inside the greenhouse. These values give you insight into the climate you create around the crop. They are factors that you, as a grower, can influence directly. Examples include:
Temperature (T)
Measures the air temperature in the greenhouse or at crop level. It is used to manage growth rate, evaporation and energy use.
Relative humidity (RH)
Important for evaporation, transpiration and the risk of fungal diseases.
CO2 level
An essential resource for photosynthesis. This is often actively adjusted.
Light intensity (PAR)
Measures how much photosynthetically active light (in µmol per square metre per second) is available to the crop.
VPD (vapour pressure deficit)
Derived from temperature and relative humidity, it is an indicator of evaporative pressure.
What do we measure in plant science?
Plant science measurements focus on how the plant responds to the climate. This data shows how the plant is functioning, whether it is in balance, and whether it is growing optimally or showing signs of stress. Examples include:
Light deviation
Combines available light with the plant’s actual use of it. A high light deviation indicates inefficiency or overload.
Photosynthesis efficiency (Fv/Fm)
Shows how effectively the plant converts available light into energy. A low value indicates stress or reduced activity.
Leaf temperature
Provides insight into evaporation and heat load. Differences compared to air temperature signal plant stress.
Night values (such as night time photosynthesis efficiency)
Show whether the plant is recovering well during the night. A low night value indicates insufficient recovery, which can lead to reduced growth over time.
Conclusion
In a time where efficiency, sustainability and precision are becoming increasingly important, it is no longer enough to manage only the climate. Growers who truly want to get the most out of their cultivation look at how the crop itself responds.
With data from sensors and plant feedback systems visualised in MyLedgnd, you bring together the two worlds of physics and plant science. You not only see the state of the climate, but also how the plant is reacting to it. You detect stress moments earlier, observe the effects of climate conditions on your plant and can fine tune your cultivation strategy accordingly.
Whitepaper How to Recognize Invisible Plant Stress
Growers who steer based on data, achieve better yields and save costs at the same time.
Our latest whitepaper shows how top growers use sensors and MyLedgnd to detect stress early and manage crop health more effectively.
In this whitepaper you will learn:
- Practical case studies of invisible plant stress
- The different types of plant stress
- Which stress signals you might be missing
- The consequences of stress and how to prevent it
Download the whitepaper and discover how your crop is really performing.

New articles
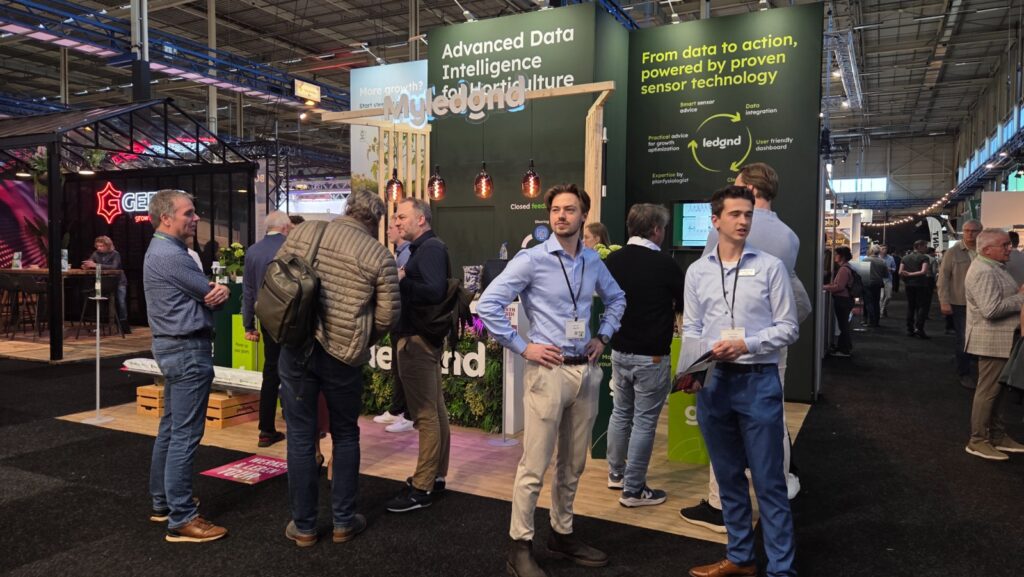
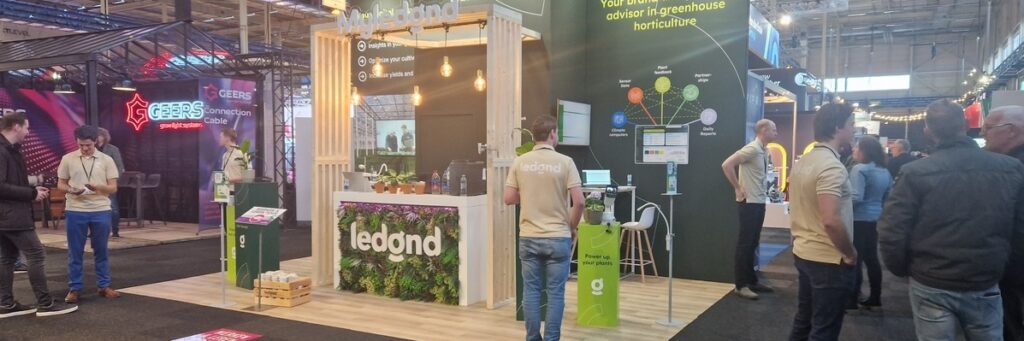
HortiContact 2026 Recap
Ledgnd Reflects on a Successful Edition of HortiContact 2026 HortiContact 2026 at Evenementenhal Gorinchem once again served as a meeting place for the Dutch greenhouse horticulture sector. Ledgnd loo…
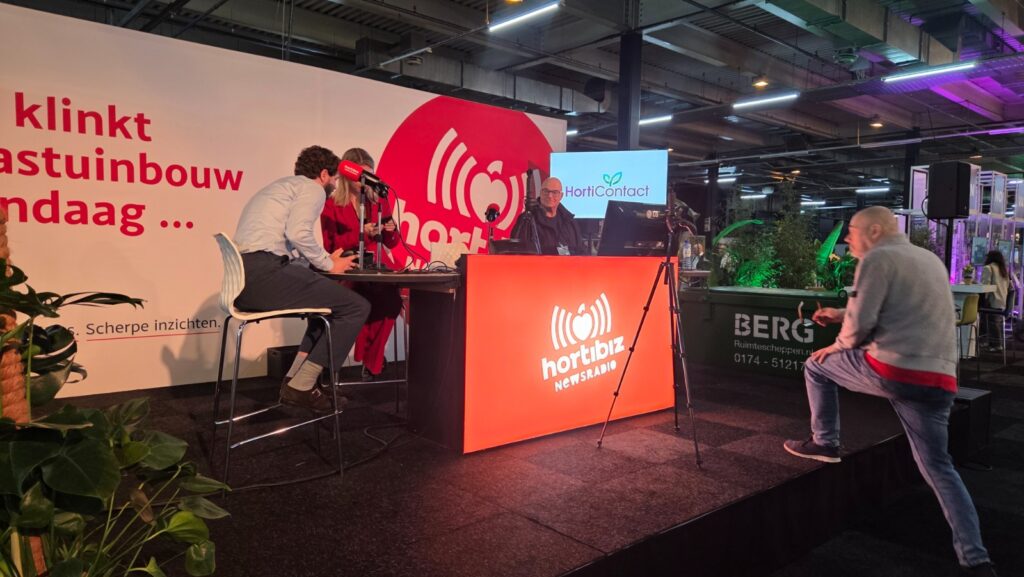
From Climate Control to Plant Control: The “Google Translate” of the Plant
During HortiContact in Gorinchem, Ramon van de Vrie spoke on the HortiBiz NewsRadio stage about a development that is becoming increasingly visible in greenhouse horticulture: the shift from climate-b…
Horticontact 2026
Weather conditions play a key role in the daily steering of the greenhouse. That is why the MyLedgnd data platform relies on reliable weather data from the KNMI. But how is this information actually g…
Read more
HortiContact 2026 Recap
Ledgnd Reflects on a Successful Edition of HortiContact 2026 HortiContact 2026 at Evenementenhal Gorinchem once again served as a meeting place for the Dutch greenhouse horticulture sector. Ledgnd loo…
From Climate Control to Plant Control: The “Google Translate” of the Plant
During HortiContact in Gorinchem, Ramon van de Vrie spoke on the HortiBiz NewsRadio stage about a development that is becoming increasingly visible in greenhouse horticulture: the shift from climate-b…
Horticontact 2026
Weather conditions play a key role in the daily steering of the greenhouse. That is why the MyLedgnd data platform relies on reliable weather data from the KNMI. But how is this information actually g…
Do you want to know more?
Interested in what Ledgnd can do for you? Leave your phone number, and we will contact you as soon as possible for a non-binding informational conversation


