What you don’t see in the greenhouse
In a greenhouse, dozens of decisions are made every day. You decide when to use the screens, how much water to provide, and whether it is time to add extra CO2. Many of these choices are based on experience, intuition, or simply routine. And that makes perfect sense, because years of hands on knowledge and practical experience are incredibly valuable.
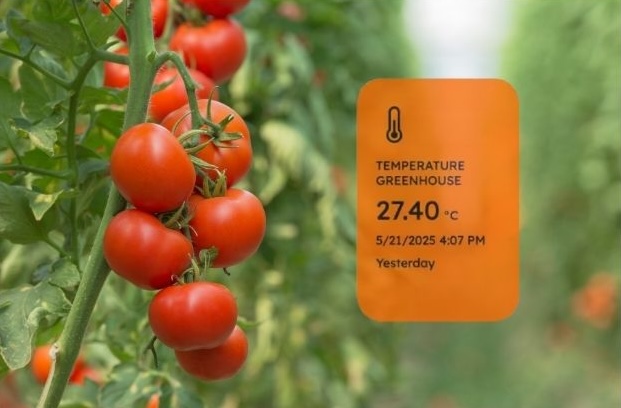
But how can you be sure your judgments are accurate if you cannot see or measure the details?
Do you know exactly how much light your plants are receiving at any given moment? Or how CO2 levels are developing throughout the day? How many PPM of CO2 is in your greenhouse at 1:04 PM? Or how the microclimate in section 3 is behaving in detail? And then comes the most important question: what does your crop actually need?
You are in control until things start to go wrong
Everything seems to be going well, and it feels like you have everything under control. But why is section 2 falling behind? Suddenly, your yields are disappointing, even though you have not done anything differently. Often, it turns out that something did change, but it simply was not visible. Some processes in the greenhouse are just invisible to the naked eye.
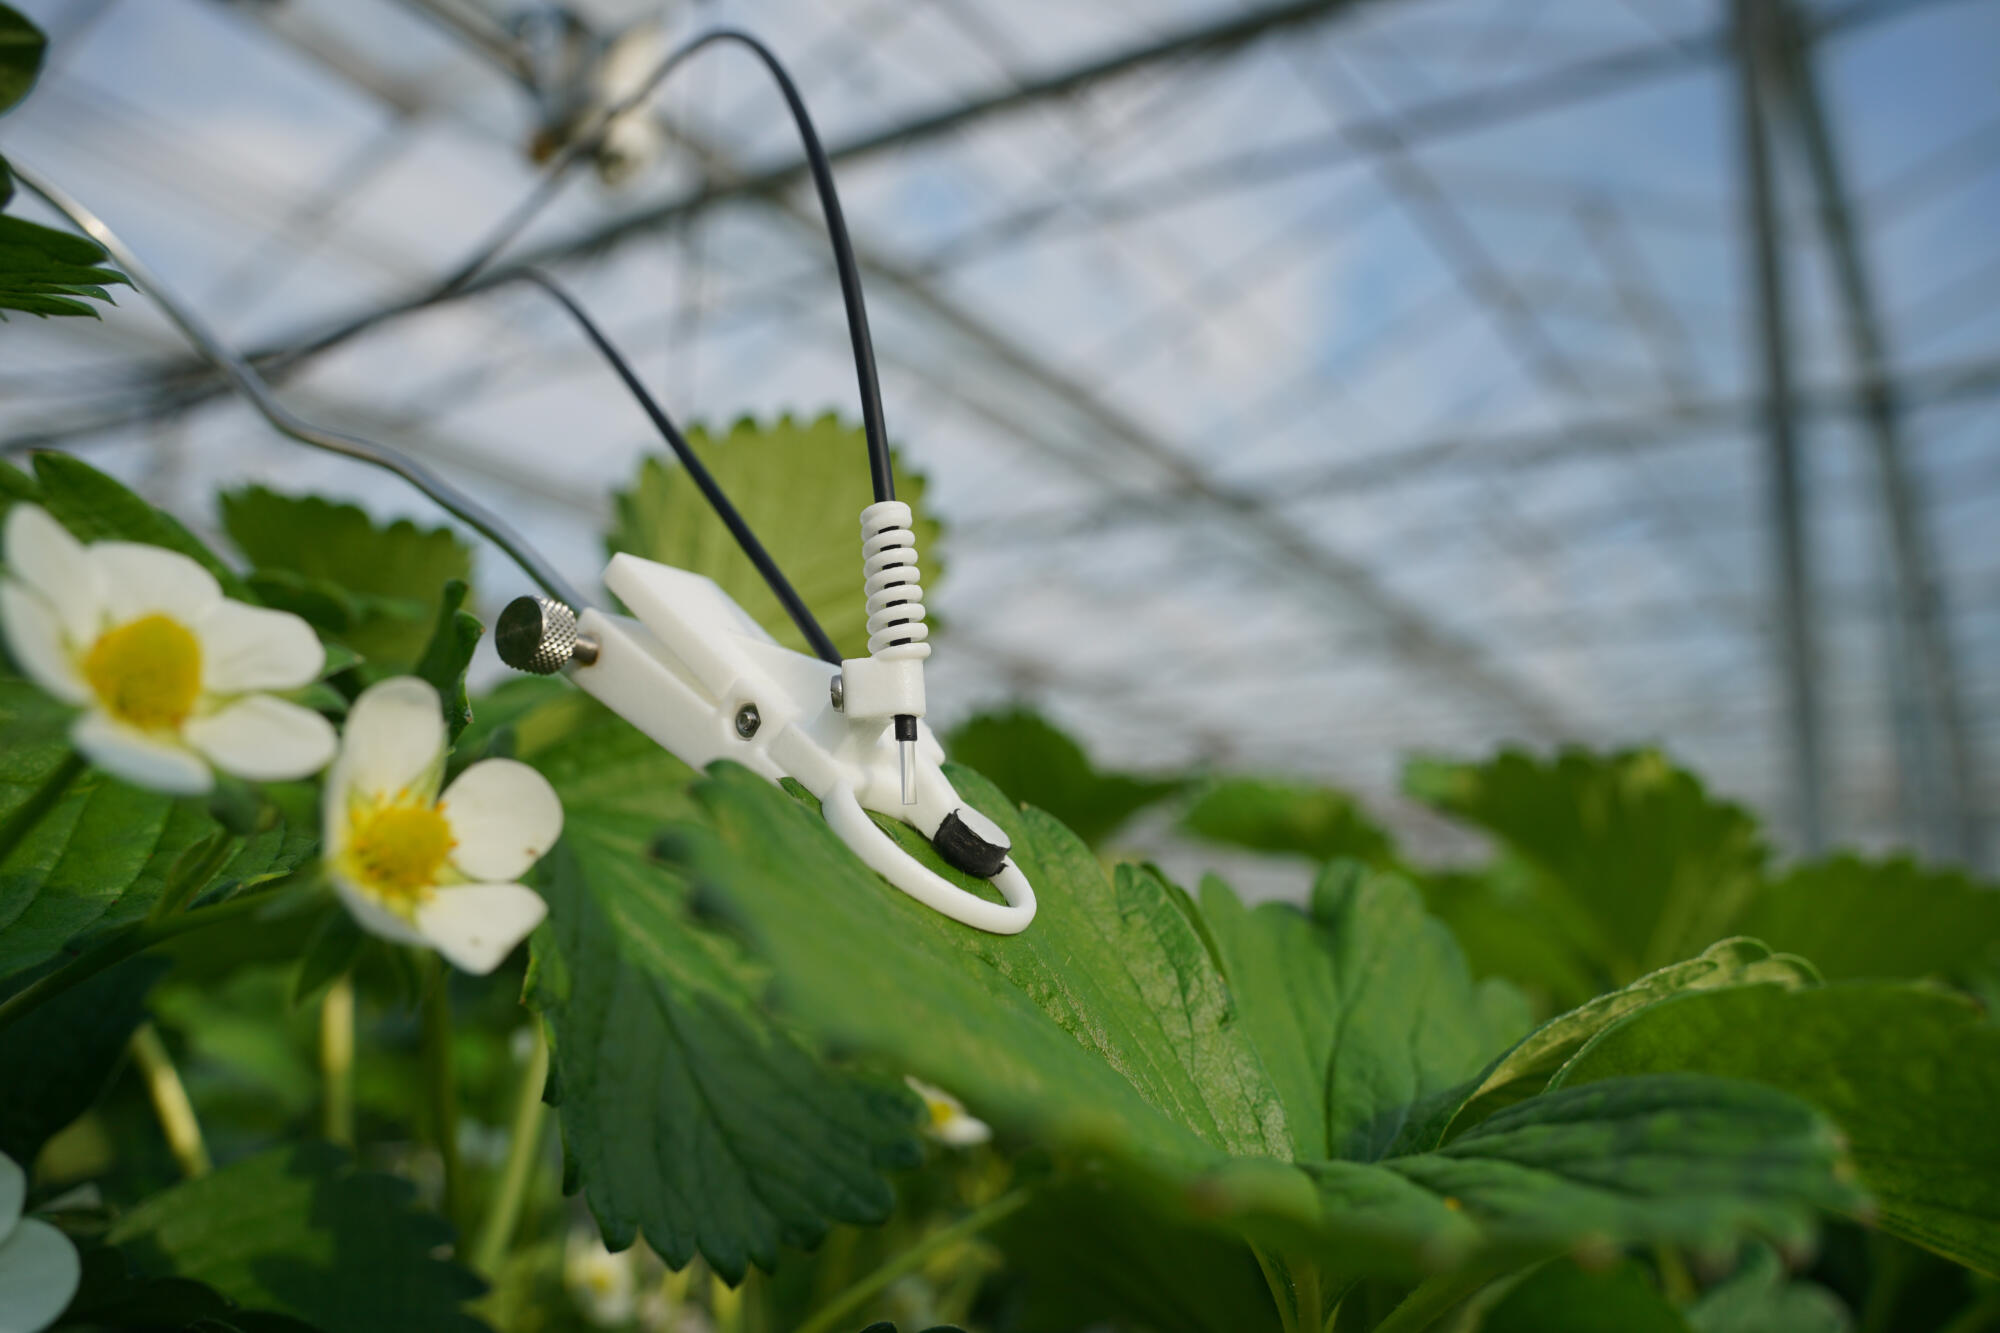
Subtle fluctuations in light, temperature, or humidity can have a major impact on the development of your crop. The problem is, you often only notice these deviations when it is too late and the crop has already been affected. And that is exactly where sensors prove their value: they make the invisible visible. They complement your experience with hard facts.
Data enhances traditional craftsmanship
With just a few smart measurements, you can already gain surprisingly valuable insights that allow you to make timely adjustments. For example, the data can show you when photosynthesis efficiency starts to drop, even before your plants show signs of stress. You might also notice that CO2 levels are falling slightly too quickly after a dosing peak. It is no longer guesswork, but a well-founded analysis.
By visualising data from sensors, plant feedback systems, climate computers, and other measurement tools in a data platform like MyLedgnd, the information becomes not only accessible but also truly actionable. All measurements come together in clear dashboards, allowing you to immediately spot deviations. Over time, you naturally start to recognise trends. By combining different data sources, you begin to identify patterns and trends that you can use to make informed decisions. This way, you are not only relying on intuition, but also on facts.
You do not need to fill your entire greenhouse with sensors tomorrow. But do ask yourself the question: “What am I not seeing in the greenhouse?” MyLedgnd helps you make the invisible visible in an accessible, flexible and scalable way, tailored to what matters most to you.
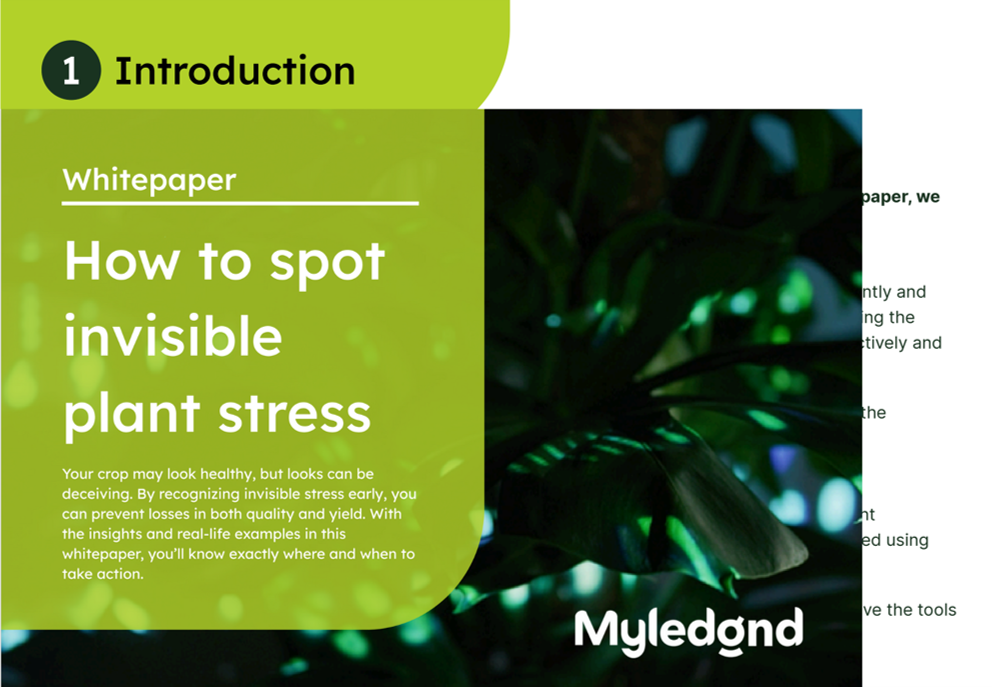
Whitepaper How to Recognize Invisible Plant Stress
Growers who steer based on data, achieve better yields and save costs at the same time.
Our latest whitepaper shows how top growers use sensors and MyLedgnd to detect stress early and manage crop health more effectively.
In this whitepaper you will learn:
- Practical case studies of invisible plant stress
- The different types of plant stress
- Which stress signals you might be missing
- The consequences of stress and how to prevent it
Download the whitepaper and discover how your crop is really performing.
New articles
Ledgnd x HortiSoccer World Cup Pool 2026 brings the horticultural industry together
With the launch of the renewed Ledgnd x HortiSoccer World Cup Pool 2026, people working across the horticultural industry once again get the chance to compete against each other during the FIFA World…
GreenTech Amsterdam 2026
From 9 to 11 June 2026, RAI Amsterdam will be all about GreenTech, the international trade fair for the horticulture sector. Professionals from around the world will come together to share knowledge a…
HortiContact 2026 Recap
Ledgnd Reflects on a Successful Edition of HortiContact 2026 HortiContact 2026 at Evenementenhal Gorinchem once again served as a meeting place for the Dutch greenhouse horticulture sector. Ledgnd loo…
Read more
Ledgnd x HortiSoccer World Cup Pool 2026 brings the horticultural industry together
With the launch of the renewed Ledgnd x HortiSoccer World Cup Pool 2026, people working across the horticultural industry once again get the chance to compete against each other during the FIFA World…
GreenTech Amsterdam 2026
From 9 to 11 June 2026, RAI Amsterdam will be all about GreenTech, the international trade fair for the horticulture sector. Professionals from around the world will come together to share knowledge a…
HortiContact 2026 Recap
Ledgnd Reflects on a Successful Edition of HortiContact 2026 HortiContact 2026 at Evenementenhal Gorinchem once again served as a meeting place for the Dutch greenhouse horticulture sector. Ledgnd loo…
Do you want to know more?
Interested in what Ledgnd can do for you? Leave your phone number, and we will contact you as soon as possible for a non-binding informational conversation


