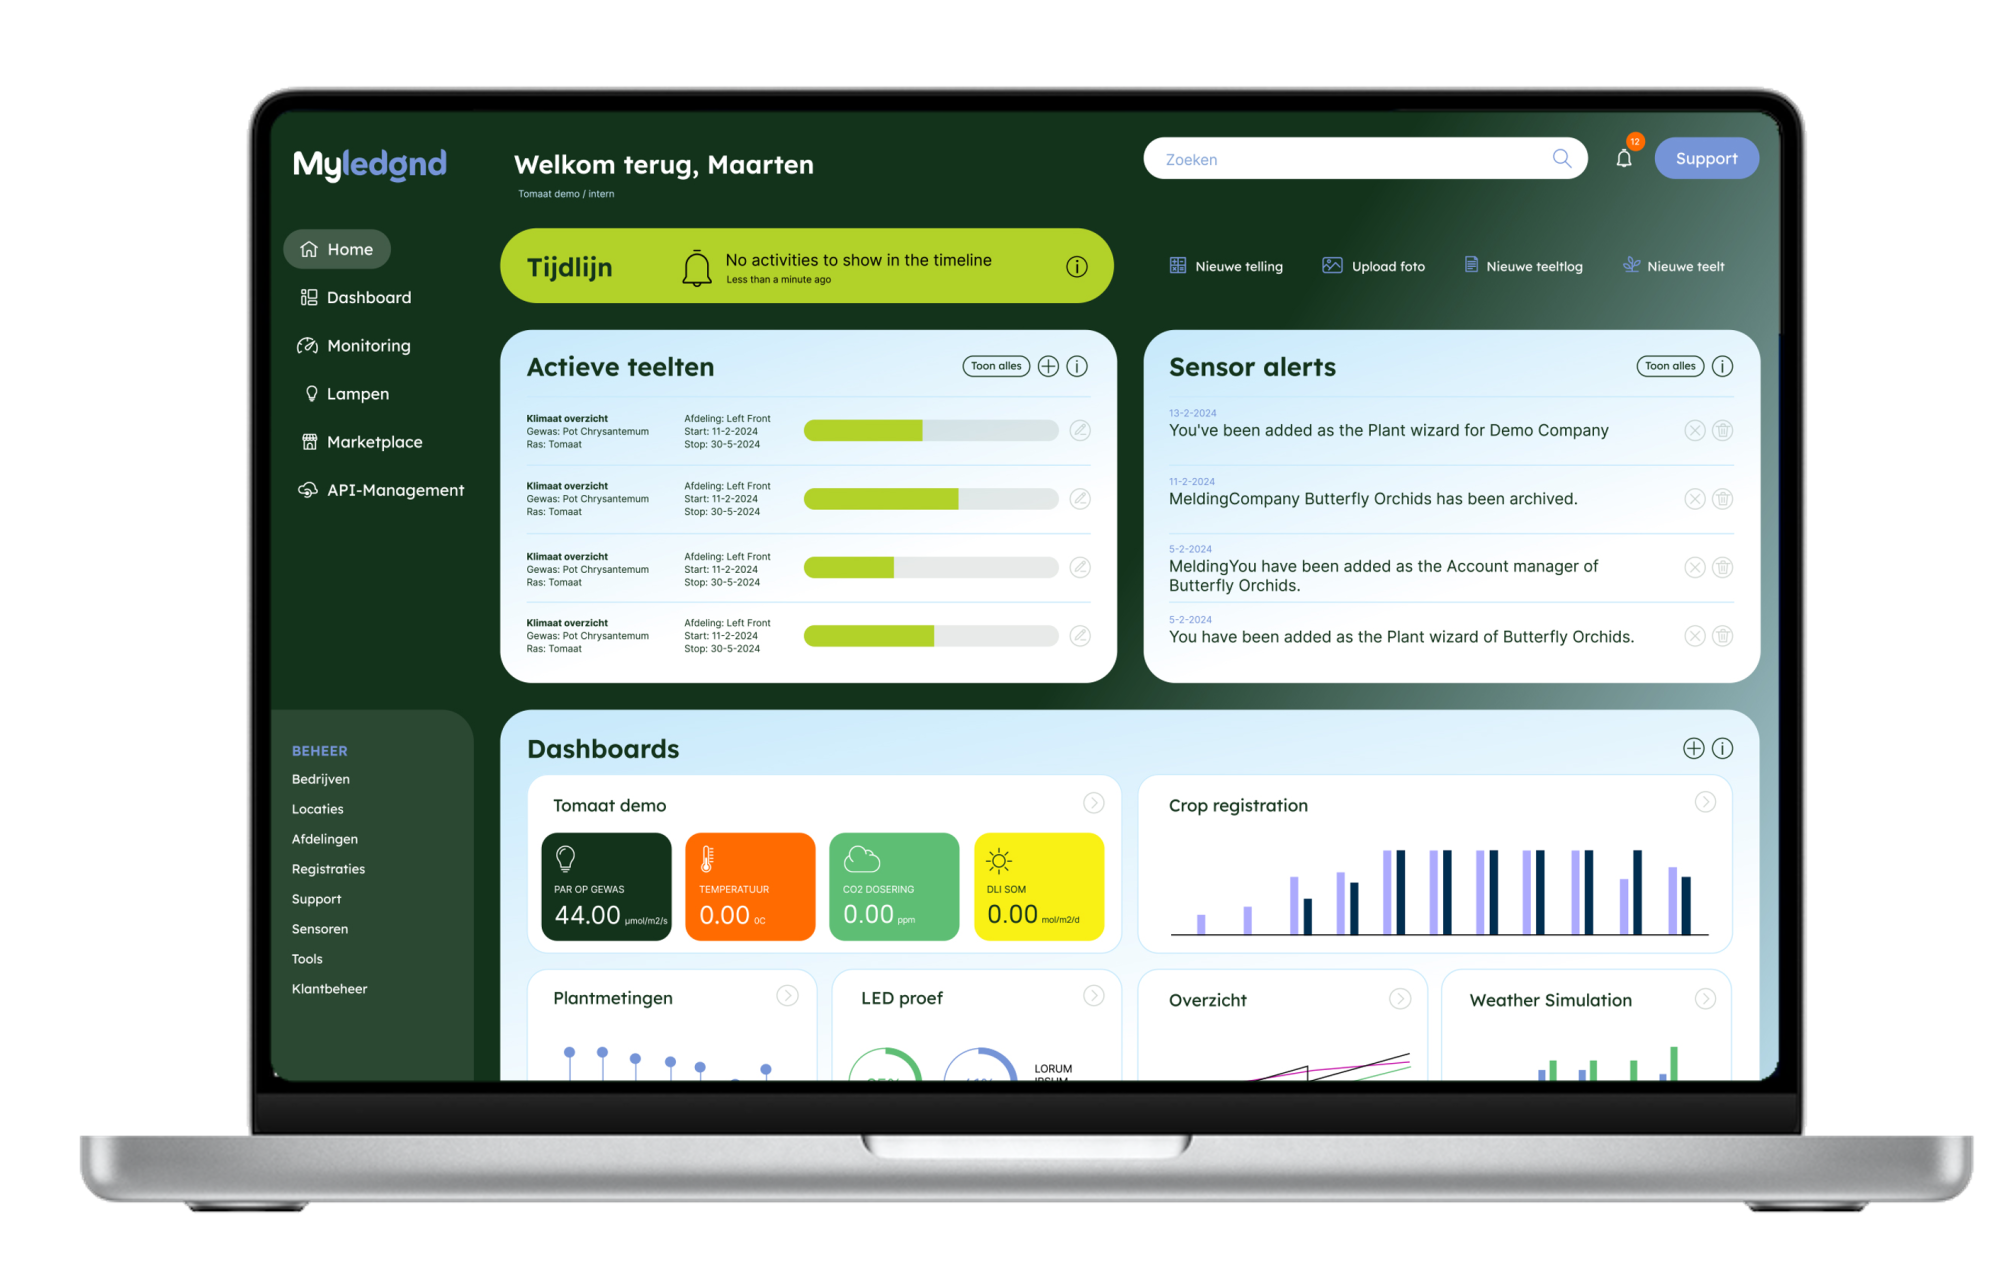
With MyLedgnd, you centralize all your greenhouse data in one platform. This allows you to monitor and optimize crop growth, resource efficiency, and plant health in real time.
The next step in precision horticulture starts here
-
All climate, sensor, and plant data in a single overview
- Complete insights into what your crop truly needs
-
Customized dashboards and daily performance reports
-
Real-time monitoring of stress, light utilization, and transpiration
-
Compatible with any type of sensor or climate control system
What is MyLedgnd?
From data to insight
MyLedgnd is the only brand-independent data platform for greenhouse horticulture that allows you to manage and visualize all your greenhouse data in one place.
From light measurements to photosynthesis efficiency, from CO₂ levels to soil moisture, everything comes together in one clear, intuitive dashboard. No more fragmented data, but one smart system that lets you make decisions based on facts.
The true power? It lies in the connection between what you measure in the greenhouse and how the plant responds. That’s exactly where MyLedgnd makes the difference.
From insight to action
By linking plant feedback to climate data, you gain full insight into cause and effect.
This enables you to detect stress signals earlier and make targeted adjustments faster, helping you avoid unnecessary waste of water, energy, and nutrients.
MyLedgnd turns data into action.
With daily reports, plant feedback systems, and custom analytics, you gain practical insights to support better cultivation decisions every single day.
Why growers choose MyLedgnd
Real-time insight into plant behavior
Immediately see how your crop responds to changes in light, temperature, and humidity.
Direct feedback from your plants
From photosynthesis performance to stress indicators, you receive real-time signals straight from the crop.
Integration with any climate computer
Easily connect data from any type of climate control system into one clear and cohesive dashboard.
All sensor data in one place
Collect and visualize data from all sensors, regardless of brand or supplier.
Combine data
Combine climate data, plant feedback, and sensor readings into one comprehensive view.
Data-driven cultivation decisions
Build custom dashboards tailored to your greenhouse layout, crop type, and cultivation strategy.
Flexible and greenhouse-ready
Fits any greenhouse setup, from a single compartment to multi-site operations with diverse crops.
Scales effortlessly with your business
Design clear, intuitive dashboards that grow with your operation and match your unique workflow.
Practical data
Designed for growers
MyLedgnd is built for growers, not data analysts. No complex software, but a user-friendly platform that shows you exactly the data that matters. Clear, intuitive, and tailored to your crop and greenhouse.
Whether it’s light, photosynthesis, temperature, or CO₂, you create dashboards that match your greenhouse layout and cultivation strategy.
Work with real-time insights every day, without unnecessary details or technical hurdles. Intuitive, scalable, and built for the needs of modern greenhouse operations.
>250+ happy customers
100+ data integrations available
Over 750+ hectares monitored with MyLedgnd
Active internationally
Making decisions based on real-time plant feedback
Closed Feedback Loop
(Micro)Climate
Your greenhouse continuously records environmental data such as light, temperature, humidity, and CO₂ levels.
This data forms the foundation of your cultivation strategy.
Plant feedback
Sensors provide real-time insight into how your crop truly responds, from photosynthesis and transpiration to early stress signals.
You’re not just measuring the environment, but also its actual impact on the plant.
Steering
You adjust your climate settings based on what the plant needs.
This adjustment affects the greenhouse environment again, closing the loop and starting the cycle anew.
Trusted by growers worldwide


Instant insights with widgets and KPIs
Monitor your key cultivation metrics in real time using smart widgets and KPIs. Use the default settings or fully customize them to match your crop and goals
Flexible charts
Toggle data lines on or off, zoom in on specific timeframes, and analyze measurements in detail. Accurate, intuitive, and fully tailored to the information you need.
Integrations with all your existing systems
MyLedgnd seamlessly connects with your climate computer, sensors, plant feedback systems, and other software. Easily link multiple data sources via APIs and manage everything from one central online platform.
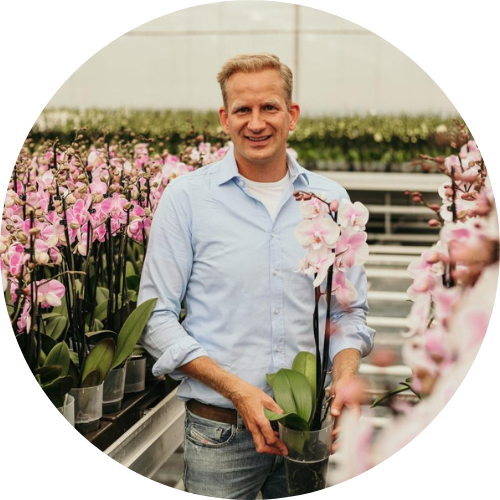
“I monitor the graphs in the climate computer daily. When I spot irregularities, I turn to the photosynthesis sensor data in MyLedgnd for deeper insight.”
Martijn van Geel
Van Geel Groep
“I’m genuinely impressed. Ledgnd is a young company that approaches things differently, and I found that refreshing and very positive. If I were to rate them, it would definitely be a 9 out of 10.”
Joost van Adrichem
Phalaenova
“I’m really enthusiastic. Ledgnd is a young company with a different outlook, and I found that both refreshing and positive.”
Laurens van Oord
Laurant Fleur
From fragmented data to integrated cultivation insights
One dashboard, all the insights
Sensors measure critical variables in and around the plant; from light intensity and leaf temperature to photosynthesis efficiency and soil moisture. On their own, these are valuable signals, but true insight only emerges when you connect the dots.
MyLedgnd links all these measurements in real time and translates them into clear graphs, trends, and alerts. This lets you see not only what’s happening in the greenhouse, but also what it means for your crop.
You don’t need to be a data specialist to work with MyLedgnd. The platform makes complex measurements easy to understand and directly applicable to your daily operations. The dashboard shows you exactly where to adjust, which factors are interrelated, and how to act on them—so you can optimize smarter and at the right moment.

Net Radiometer
This sensor measures the difference between incoming and outgoing radiation (net energy exchange). What can you do with it in MyLedgnd? You can link the radiation balance to plant temperature, air temperature, and transpiration for a precise energy balance analysis.
PAR-sensor
De PAR-sensor meet de hoeveelheid fotosynthetisch actief licht (400–700 nm) die de plant bereikt. In MyLedgnd zie je realtime en historische lichtcurves waarmee je het lichtaanbod en de belichtingsstrategie kunt optimaliseren. 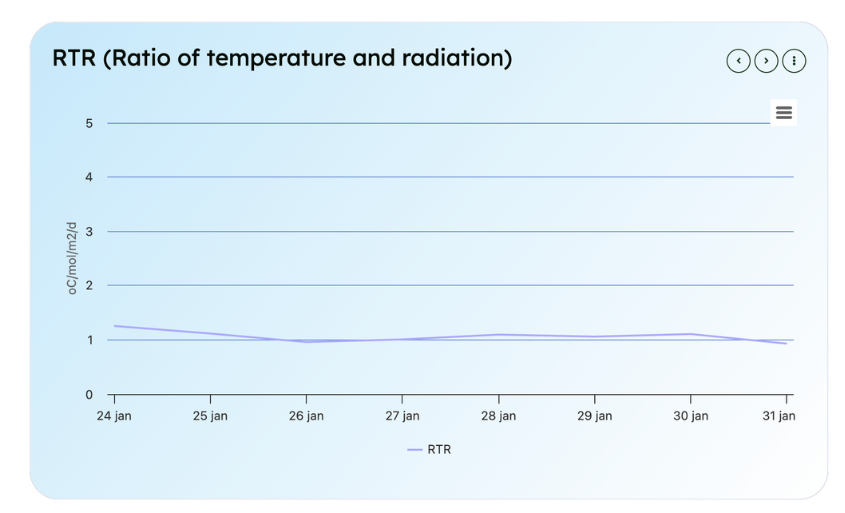
Stomata Camera
The stomata camera measures the degree of stomatal opening on the leaf surface. This provides insight into how the crop responds to environmental factors such as light, temperature, and CO₂.
CF2GO
The CF2GO measures chlorophyll fluorescence in leaves, providing insight into the plant’s photosynthetic efficiency. In MyLedgnd, you can see whether the plant is making optimal use of available light and detect signs of light stress or other physiological limitations.
`
Soil Moisture Sensor
This sensor measures the moisture content in the substrate or soil. In MyLedgnd, you can track how moisture levels evolve over time, enabling you to fine-tune irrigation to match your crop’s needs. 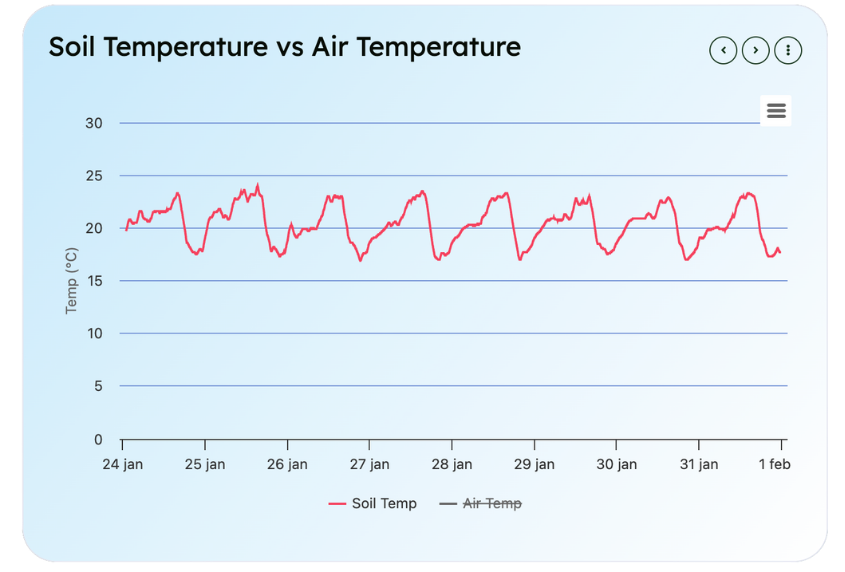
Partners
In MyLedgnd, data from every corner of the greenhouse comes together. Thanks to integrations with reliable and innovative technology partners, all this information is presented in a clear and practical way.
We are brand-independent and only connect with systems we trust, systems growers can rely on. That way, we don’t just provide insight into what’s happening, but also give you the confidence to make data-driven decisions that truly advance your cultivation.